Issue
Marxism and women's liberation
Playback speed:
The purpose of this article is to examine the changing shape of Australian capitalism in the neoliberal age.[1] In the first section I examine the industrial restructuring that Australia has undergone, in particular the rise of the service sector, the decline of manufacturing, the boom in the resources and energy sector and the growing role of financial capital. This section will also briefly review Australia’s changing engagement with international capitalism and the nature of state-capital relations under neoliberalism. The second section will review what has been dubbed the “new golden age” of Australian capitalism, the 22 years of economic expansion that has occurred since 1991.[2] How exceptional has this “golden age” been in terms of past and international experience? This will be followed by an analysis of the fortunes of the working class during this period. The article concludes with an assessment of the situation facing Australian capitalism today as the resources investment boom is wound back and Australian bosses and politicians make increasingly shrill demands for an end to the supposed era of “entitlement” that has accompanied the period of economic growth.
On a broad-brush perspective there is no doubt that the Australian economy has undergone a substantial restructuring. This is often summarised as the rise of the “services economy” and the decline of “metal-bashing industries”. The problem with these categories is that they disguise as much as they reveal.
In a review of economic restructuring in Australia over recent decades, two Reserve Bank economists suggest that the “services sector” has grown steadily since the 1970s and now accounts for 78 percent of output.[3] But which services have grown and which have declined? The Australian Bureau of Statistics (ABS) provides more fine-grained data. In terms of their contribution to total value added, the growth areas since 1974 have been health care and social assistance, professional, scientific and technical services, financial and insurance services and information media and telecommunications.[4] By contrast, public administration and safety and education and training have experienced modest declines in their contribution to the total. This does not mean that these latter sectors have shrunk, far from it, only that their relative contribution has fallen.
In relation to employment, the services sector has also grown as a proportion of total jobs, which rose by three quarters between 1984 and 2013. The strongest increase occurred in professional, scientific and technical services, where employment is up by 250 percent, administrative and support services (226%), arts and recreation services (188%), health care and social assistance (157%), accommodation and food services (143%) and rental, hiring and real estate services (139%).[5] However, other service sectors, including those often seen as paradigmatic of the “new economy”, saw lower than average jobs growth; these include information media and telecommunications (38%) and financial and insurance services (57%).

The growth of the financial and insurance sector as a lynchpin of the Australian economy is one of the most notable changes in the past four decades. Despite accounting for only 3.5 percent of the workforce, its share of total industry value added doubled from 5 percent in 1975 to 10 percent in 2012[6] while profits of the big financial corporations rose from 5-10 percent of the total to 20 percent over the same period.[7] Even these figures understate the influence wielded by financial capital as the banks usually feature large on the share registers of big ASX 200 companies and their directors are commonly to be found on the boards of businesses across a wide range of sectors.
Far from being a paragon of the market economy, as it likes to boast, the financial sector is a cosy cartel that profits substantially from government assistance. Banking “deregulation” by the Hawke and Keating governments, far from hastening a better deal for consumers, only led to greater monopolisation by the Big Four.[8] The market share of the Big Four rose from two-thirds in the early 1980s to 83 percent in 2010 as barriers to mergers and acquisitions were lifted.[9] The margin between the rate at which they could borrow from the Reserve Bank and the rate at which they lent money to business and households edged upwards.
The result is that Australian bank profits have ballooned: they are now the most profitable in the world.[10] Real estate has been central to their fortunes. The scrapping or dilution of government restrictions on lending, the restoration of negative gearing after it was briefly lifted in the 1980s, the halving of capital gains tax by the Howard government in 1999 and the succession of first home buyer schemes have inflated the property market, leading to Australia having some of the most expensive homes in the developed world (measured by the ratio of house prices to average earnings).[11]
The Australian state subsidises the banking system in numerous ways. During the global financial crisis, the Rudd government guaranteed the assets held by the banks, boosting their credit rating and cheapening their borrowing on international money markets. As customer deposits are underwritten by the Reserve Bank, this further boosts the banks’ bottom line. By one estimate, the Reserve Bank underwrites Australian banks to the tune of $380 billion.[12]
Like the banks, the superannuation industry has also floated to prosperity on the back of government assistance. The compulsory superannuation levy on salaries has generated a big pool of funds, now standing at $1.6 trillion, from which the industry clips a fee of, on average, 2 percent every year. A range of tax breaks on superannuation accounts, which overwhelmingly favour those with big balances, keeps money flowing into the sector. In 2012 Treasury lost more than $30 billion in revenue due to such concessions, only slightly less than the $34 billion outlaid on state aged pensions.[13] In 2016, revenue foregone is projected to rise to $45 billion, dwarfing spending on state pensions.[14]
The same government subsidisation is also apparent in the private health insurance industry. In 1999, the Howard government, concerned that the industry had been squeezed by public health insurance, introduced a series of sticks and carrots to force people to take up private health insurance. By 2013, the subsidies to private health cover had risen to $5.6 billion.[15] The result has been an influx of funds to the industry. Coverage, which had fallen from 80 percent in 1975 before Medibank was introduced to only 30 percent by 1999, jumped to 45 percent on the back of these inducements.[16]
The resources and energy boom, driven by rapid Chinese industrialisation, has been the most significant structural change to the Australian economy in the past two decades.[17] Accounting for 11 percent of GDP, up from 8 percent in 1974, mining is the single biggest industry, leapfrogging manufacturing and construction.[18] The resources and energy sector is overwhelmingly the biggest export industry, with exports rising from 36 percent of the total in 2001-02 to 61 percent ten years later.[19] It is also responsible for a big slice of Australian corporate profits, rising from 11 percent of the total in 2003-04 to 38 percent in 2011-12.[20]
Like the financial sector, the resource and energy industry bosses like to boast of the virtues of “free enterprise”. Its own practice is rather different. Every year the mining companies gouge at least $4.5 billion in subsidies and tax concessions from the federal government.[21] On top of that, they also garner state government subsidies estimated in 2012 at $1.4 billion per year in the case of Queensland alone. Further state assistance to the industry takes the form of infrastructure provided by state and federal governments – the roads, railways, port development and so forth – that allow the industry to operate.[22] In the Hunter Valley alone, the federal and NSW governments are contributing $855 million to upgrade the railway line to the port of Newcastle. The mining industry also benefits from fringe benefits tax exemptions valued at tens of millions of dollars annually.[23]
The mining industry has also become an important political player, evident in 2010 when it mobilised against the Rudd government’s proposed resources super profits tax.[24] This tax, which enjoyed strong bourgeois backing from the Henry Tax Review, would have taken money from the mining industry bosses and distributed it to other capitalists through a cut in the company tax rate. The capitalists in mining mounted a counter-offensive, spending nearly $30 million in media advertising in just six weeks. While Rudd was losing support from his parliamentary colleagues for a host of reasons, the mining industry offensive was the final straw. Incapable of rallying the labour movement against the mining barons, the Labor caucus sacked Rudd as leader, scuppering the super profits tax in the process. Subsequently Gillard introduced a much weaker mining tax and watered down the tax cuts for other capitalists. The resulting mining tax in its short life has raised virtually no money and is destined for abolition by the Abbott government, a stunning vindication of the industry’s leverage.[25]
The power of the mining bosses was also on display when it was mobilised against the original carbon pricing mechanism tabled by the Rudd government. While this was always a regressive measure, in that it shifted the cost of reducing carbon emissions onto the working class,[26] the resource companies engineered it to substantially reward them for their pollution. This too is destined for abolition by the Abbott government. The result is that the mining companies have seen their profits grow virtually untouched even as other sectors of the Australian capitalist class have fared less well.
Manufacturing has been in relative decline for many years. In the middle third of the century Australian manufacturing enjoyed significant growth: its share of GDP, which was only 12 per cent in 1921, rose dramatically to nearly 30 percent by 1959.[27] Since the 1970s, however, its share of GDP has dropped back sharply and now stands at only 8 percent.[28] This is one of the lowest figures out of any comparable country, ranking alongside only Norway, another resource-intensive country. In France, Denmark, the United States and Belgium manufacturing’s share stands at 10-14 percent, in Sweden and Italy at 16-17 percent and in Germany at 24 percent.[29]
Not only is Australian manufacturing at the low end of the international comparison, but its rate of decline since the 1970s, as a contributor to GDP, has also been the most rapid.[30] Manufacturing has gone from having twice the relative weight in GDP as mining to only three quarters, even though it employs nearly four times as many workers.
The shrinking share of GDP represented by manufacturing does not mean that manufacturing output has fallen in absolute terms. Indeed, between 1978 and 2003, output rose strongly.[31] However, since that time most sectors have been in retreat. Textile, clothing and footwear output has been in long term decline. The steel industry has seen mill closures in Port Kembla and Newcastle and big cuts to employment at Western Port over the past two decades. Much of the steel now used in Australia is produced in China or Korea using Australian coal and iron ore.
Automotive production has also suffered severe cuts since 2003 when the resources and energy boom started to push the dollar up, making imports more competitive, exports less so. Total production of passenger vehicles nearly halved from 407,000 in 2003 to 221,000 in 2012, with the iconic Ford Falcon and Holden Commodore faring particularly badly.[32] This decline comes on top of Nissan ceasing local production in the 1990s and Mitsubishi in the 2000s. Employment by the vehicle producers halved between 2003 and 2012 as the industry’s fortunes switched from racking up an average annual profit of $300-400 million in the late 1990s and early 2000s to recurrent annual losses of $200-700 million in 2005-12.[33]
The varying fortunes of different industries have had a significant effect on the geographical dispersion of the Australian economy. Between 1985 and 2013, the shares of NSW and Victoria in total state final demand fell from 60 percent to 52 percent, whereas the share of resource-rich Queensland, WA and NT rose from 27 percent to 36 percent.[34] Even these figures understate the shift as they do not factor in the contribution of international trade. With Western Australia and Queensland together accounting for nearly two thirds of total merchandise exports in August 2013, the shift in the centre of gravity of Australian capitalism to the resource-rich states is clear.[35]
If mining has grown strongly and manufacturing declined, construction, another important blue collar industry, has seen its share of value added and employment fluctuate between 7 and 9 percent, currently at the higher end. It now employs one million workers, more than double the figure in 1984, and is the third-largest employer in the country, standing behind only retail trade (1.2 million) and health care and social assistance (1.4 million).[36]
That construction and manufacturing alone account for two million jobs challenges the notion that blue collar industries are becoming only marginal employers. Nonetheless, growth has not been as strong as among “white collar” industries. Compared to overall employment growth of three quarters between 1984 and 2013, jobs in transport, postal and warehousing rose by 55 percent and wholesale trade by 28 percent, while electricity, gas, water and waste services effectively stood still. Employment in agriculture, already in long term decline, fell by a further 21 percent and now stands at only 2.7 percent of the total.[37]
Thus far, the story fits the “common sense” understanding of structural change in the Australian workforce with blue collar industries for the most part in decline, in relative terms, and service sector jobs on the rise. These data, however, only give a very incomplete picture in two important respects.[38] The nature of the industry does not necessarily determine the nature of the work. Evidently, there are many “service workers” in manufacturing industry, such as catering, security, cleaning, accounting and information systems. Likewise, there are plenty of workers in the service sector who actually carry out blue collar work, that is physical manual labour – such as hospital ward orderlies, Telstra ditch diggers, even fast food workers and supermarket shelf stackers.
Occupational data tell us that between 1996 and 2013 the share of managers, professionals and community and personal service workers in the workforce all rose, while technicians and trades fell back, as did labourers and machinery operators and drivers.[39] However, clerical and administrative workers and sales workers also fell in importance. The most obviously “manual” occupations – labourers, trades and technical workers, machinery operators and drivers – still account for just under one third of the workforce. We might also add nurses and community and service workers such as fire-fighters to the blue collar ranks.
The long term rise in “precariousness” evident between the 1980s and the turn of the century has come to a halt in the past decade. During the earlier period the number of casual workers, workers employed by labour hire companies and independent contractors grew steadily.[40] Growth in employment in the first decade of the twenty-first century, by contrast, came among the ranks of permanent workers, whose share of the workforce rose by three percentage points. The share of these workers grew primarily at the expense of owner managers of unincorporated enterprises, putting paid to the Howard-era mythology of a burgeoning class of self-employed entrepreneurs striking out on their own.[41]
Another major dimension to capitalist restructuring in the past three decades has been its growing international integration. While Australian capitalism, with its origins as a colonial settler state, has always been a significant net importer of capital, international merchandise trade has fluctuated over the decades.
For most of the nineteenth century, colonial economic development was tied tightly to the export of a narrow range of primary products to Britain in exchange for manufactures and capital goods.[42] Following the economic crisis of the 1890s, the favoured policy turned towards import substitution and the development of a more broadly based domestic economy. From the 1920s onwards this was promoted by high tariffs on secondary industry.[43] The ratio of trade to GDP fell off as a result.
From the 1960s onwards, following international trends, Australian capitalism began to switch back to a more export-focused development strategy, using international competition to weed out more inefficient capitalists and to shift the share of surplus value to the more efficient sectors. The mining boom of the late 1960s helped this process, as did the 25 percent tariff cut of 1973. The 1983 Closer Economic Relations Trade Agreement with New Zealand has drawn the latter ever more tightly under the wing of Australia. The Hawke and Keating governments vigorously pursued this “free trade” agenda. The result was a dramatic drop in effective rates of government assistance to Australian industry.[44]
With multilateral trade agreements through the WTO becoming increasingly difficult to finalise in the 1990s and 2000s, Coalition and Labor governments have negotiated a succession of bilateral free trade agreements with the US, Chile, Singapore and Thailand. The Abbott government announced, in its first days in office, its intention to finalise such agreements with China, Korea and Japan in its first term. The Australian capitalist class is also a keen proponent of the Trans Pacific Partnership, a multilateral agreement involving 14 states negotiated outside the WTO framework and designed to consolidate trade and investment within a US-led trade bloc in competition with rising Chinese influence. These can be understood not just in terms of perceived economic advantage but also strategic considerations in advancing Australian power in the Asia-Pacific.
Growing international integration of the Australian economy is indicated by an increase in import penetration of the home market from 17 percent in 1970 to 37 percent in 2012 and an increase in the share of exports in GDP from 15 percent of GDP to 21 percent in 1997.[45] The export share of GDP has plateaued since then but the anticipated surge in exports of minerals and LNG associated with investments coming to fruition will lift the figure substantially.

Agriculture, chiefly wool, which used to dominate Australian exports, has been in steady decline for decades and in 1982 was overtaken by mining. Now, at just over 10 percent of total exports, the sector is well shy of the 50 percent that it accounted for at the peak of a commodity price boom in 1973.[46] It is conceivable that with household incomes in Asia rising steadily and diets changing, Australian agriculture will begin to recover on the back of exports of meat, wheat and dairy products but it is too early to be confident on this score.
In contrast to agriculture, education and education-related travel have boomed as Australian universities have aggressively recruited students across Asia. Of the one million students enrolled at Australian universities, more than 22 percent are international students, by far the highest in the OECD where the average is only 6 percent.[47] With earnings of $15 billion in 2012, education and education-related travel is now the third-biggest export industry, behind only coal and iron ore.[48] It is not just the universities and colleges that get a slice of this pie: 60 percent of these dollars are spent on the flights and onshore living expenses of international students, so the airlines and hospitality, real estate and retail industries also reap dividends.[49]
Increased investment overseas is another indicator of Australia’s growing involvement in international circuits of capital accumulation in recent decades. The stock of Australian investment overseas, mostly in advanced economies, has grown from $516 billion in 2001 to $1.3 trillion in 2012, while the stock of foreign investment in Australia has grown in the same period from $857 billion to $2.2 trillion.[50] As Australian companies succeed overseas, they have in some cases listed in London or New York, News International and BHP Billiton being the two best known cases.
Greater international economic integration has been used as a whip to discipline the working class and to squeeze less successful capitalists. The Gillard government’s 2012 White Paper “Australia in the Asian Century” spelled out a series of opportunities for Australian business from the continuing rapid economic growth in Asia and the measures that were going to be required to take advantage of them.[51] The message was familiar: further deregulation, “better integration of financial markets”, greater involvement of the private sector in infrastructure provision, tax reform and free trade treaties. Productivity in Australia, although high, had to increase further. Outsourcing, via enhanced “regional production chains”, had to be accelerated. Although the Abbott government has now disowned the White Paper, it will continue to aggressively follow the same agenda.
One final element of international integration concerns the role of immigration. Australian capitalism has always depended on a steady inflow of labour as well as capital. Immigration provided a major boost to the Australian workforce during the long post-war boom. During the 1970s and 1980s, its relative contribution to the growth in the Australian workforce stabilised but it has now once again become an important factor. Over the past decade, between 100,000 and 150,000 permanent arrivals, predominantly peak working age, have settled in Australia every year.[52]
There are now nearly five million migrants living in Australia, accounting for 21 percent of the resident population, the largest migrant share of all the developed capitalist countries.[53] The character of the immigration program has changed in recent decades. Business and skills-based migration has supplanted family reunions as the basis for most applications for residency as successive governments have sought to harvest talent from around the world.
Another important source of workforce growth has been international students staying on after graduation. Of the 230,000 international students studying at Australian universities, a conservative estimate is that about 30 percent of those graduating from their programs will apply to change their visa status, overwhelmingly to one that allows applicants to seek employment.[54] Australian businesses have been big winners from these developments. They have benefited from an enlarged market of prospective employees and have had to pay little in the way of taxes for their upbringing and education.
New Zealanders represent another substantial category of migrant labour, with more than 650,000 residing in Australia in 2013. They no longer enjoy permanent residency and since the Howard government passed new laws in 2001, New Zealanders have not been able to access certain social security payments and many are not eligible to apply for public sector jobs requiring citizenship or permanent residency. Both factors drag down their wages.[55]
In addition to exploiting those with medium to long term residency prospects, Australian capitalists have also drawn on the labour of others with a less secure foothold in the labour market to carry out jobs ranging from wiping tables at restaurants to working on big engineering projects. Peter Mares, who has studied this topic extensively, argues that “the pool of migrant labour in which unscrupulous employers can fish for vulnerable staff is now very large”.[56]
This pool of vulnerable workers includes the 160,000 working holiday makers resident in Australia in 2013, a figure that is climbing quickly.[57] These young people provide a substantial source of under-paid labour as farmhands, waiters, cleaners, kitchen hands and bar attendants.[58] Traditionally such workers have been limited to visas of only 12 months duration but they can today extend these to 24 months: in 2012-13, nearly 40,000 young adults did so.[59] The pool also includes a substantial number of the 300,000 post-secondary (university, ELICOS, vocational education and training) international students who combine study with work. Undergraduates are legally allowed to work 40 hours per fortnight, but many work more than this and during university breaks their hours are unrestricted.
The final component of the pool of insecure migrant labour is workers on 457 visas, a guest labour scheme which has expanded rapidly in recent years. In September 2013, there were 110,000 primary 457 visa holders working in Australia.[60] In addition, tens of thousands of immediate family members are also granted 457 visas, giving them the dubious right to work on the same inferior basis.
The contribution of these three categories of workers is substantial: all told, working holiday makers, international students and workers on 457 visas make up one fifth of the total labour force aged 20-24.[61] Such workers represent a growing section of the workforce with legally inferior rights and entitlements, making them more subject to abuse and underpayment, while also making them less likely to be involved in trade unions given their exclusion from the full rights extended to citizens or permanent residents.
The emphasis on immigration as a source of labour can also be understood as part of a broader ruling class project to boost the population. Historically, this was driven by racist “populate or perish” anxieties fuelled by the supposed “Threat from the North”. The racist framing of population policy has receded a little in recent years and it now appears to be driven more by a desire for a bigger workforce and a bigger market. If Australian capitalism is to compete on a global scale, the bourgeoisie needs a larger home base from which to build. Nonetheless, the strategic element is still significant: a bigger population is important in projecting Australian imperialist power, both in the region and on the world stage. A bigger population also makes it easier to fund greater military spending.
The Australian population is growing at a much faster rate than most similar countries. Between 1980 and 2012, it rose by more than half to 22.7 million, outpacing Canada which recorded a 42 percent increase, followed by the United States at 38 percent. Other comparable countries grew much more slowly: France by 19 percent, the UK by 12 percent, Japan by 9 percent and Germany by less than 5 percent.[62]
Despite the fantasies of the neoliberal theorists, the Australian state in the neoliberal age is far from retreating into irrelevance. Government outlays as a proportion of GDP have fluctuated between 23 and 26 percent between 1990 and 2013 and have shown no tendency to decline.[63] Indeed, during the latter years of the Howard era, government spending surged, much to the chagrin of the Prime Minister’s neoliberal advisers.[64] The Rudd government’s stimulus program of 2008-09 also channelled billions of dollars to selected industries, retail and construction in particular.
The state is as important as ever in protecting the interests of private capital. This is obvious from the massive subsidies enjoyed by finance and insurance and the resources sector described already. Other aspects of state support for the private sector include public-private infrastructure partnerships and the contracting-out of public transport to private providers, both of which involve ongoing state subsidies and bailout options for private financial interests in the event of losses or failures. The handing over of prisons and detention centres to companies such as Serco and G4S also involve long term state funding of these institutions while many areas of manufacturing would be unviable without the constant flow of funds from the military budget. While the Howard government undertook some cuts, federal government budget assistance to industry actually rose by 50 percent during his government.[65]
The state continues to provide the basic financial, military, penal, legal and administrative infrastructure on which capital depends – the Reserve Bank, the Australian Defence Force, the various police and “security” agencies funded by state and federal governments, the courts system and the public service departments which oversee provision of everything from water and roads to export promotion and air traffic control. In 2012, more than 600,000 people were employed in public administration and safety.[66] The penal arm of the state in particular continues to expand. Police staffing in the biggest four states rose from 50,738 in 2005-06 to 56,716 in 2010-11 and the number of people incarcerated in Australian prisons increased from 22,492 in 2002 to 29,381 ten years later.[67]
Then there are the arms of the state that bolster the profits of the private sector indirectly by making the working class more productive. The fact that employment in public sector education and training and health care and social assistance rose by 80,000 to a total of one million between 2008 and 2012, despite waves of redundancies and restructuring, is noteworthy.[68] Growth in these sectors is evidence not just of the fact that workers in these industries are much less prone to technological displacement (when compared to those in telecommunications or stevedoring, for example), but also the continuing significance of the reproduction of the workforce for modern capitalist success. The neoliberal myth of an ever more denuded welfare state consistently butts up against the reality of the needs of the capitalist class for an educated and healthy workforce.
Public sector workers may not directly produce surplus value for the most part but they do enable greater extraction of surplus value elsewhere. This has important political consequences. In aggregate, public sector education and training, health care and social assistance and public service workers come to more than 1.6 million employees and, by the standards of most other industries, they remain strongly unionised, giving some indication of their strategic power.[69] Even if they for the most part lack the ability to bring big capitalist enterprises to a halt in the short term, in the way that workers in manufacturing, mining or transport can, they are not irrelevant to the class struggle.
What is the evidence that the Australian economy has enjoyed a new Golden Age since the recession of the early 1990s? At first sight, the economic growth figures look impressive. The economy has nearly doubled in size in real terms since 1992 and is now enjoying its twenty-second consecutive year without technical recession. On the back of the strong dollar and steady economic growth, Australia climbed the economic ranks and in 2012 was the twelfth-richest country in the world, with a GDP, at US$1.5 trillion, higher than those of Spain, Mexico or South Korea.[70] On a US dollar per capita basis, Australia had the third-highest income (if the microstates and tax havens are excluded).[71]
By comparison with most other advanced capitalist economies, Australia appears to have fared remarkably well in the last couple of decades. The long years of unbroken growth have been described by one business economist as “a feat without parallel in Australia and indeed, around the industrialised world” and “a truly remarkable and wonderful achievement.”[72]
Most mainstream commentary attributes this record of sustained growth to the economic reform program of the Hawke and Keating governments. Successive books by Paul Kelly (The End of Certainty, 1992; March of the Patriots, 2009)[73] have done much to popularise this argument. Kelly argues that the major legacy of the Hawke government was that it for once and for all smashed the “Australian Settlement” which had dominated Australian economic development for the preceding eight decades. Its main ingredients were White Australia, Empire loyalty, all-round protectionism, government economic interventionism and the centralised system of industrial arbitration.
Kelly argues that not only did the Settlement become untenable by the early 1970s, it had been a mistaken strategy for its entire existence. It reduced productivity and thus growth, it prevented Australia from fully engaging with Asia and it locked the country culturally into an obsession with Britain. Kelly further argues that the Settlement required government support to prop up failing industries, thereby preventing the resources from being redeployed to more productive use, and an arbitration system which gave artificial support to state-sanctioned trade unions and prevented a competitive labour market from functioning.
Kelly argues that the Australian Settlement crumbled when the Hawke government floated the dollar, opened up banking to foreign banks and lifted controls on foreign exchange in 1983-84. Subsequent reforms took this process further, with cuts to import tariffs, the corporatisation if not privatisation of public enterprises, the introduction of enterprise bargaining, the granting of independence to the Reserve Bank and increases to the immigration intake, particularly from Asia. The introduction of compulsory superannuation also both expanded the stock of investible funds and removed the costs associated with the supposedly “generous” state pension schemes of Europe. The result of these economic “reforms” of the 1980s and early 1990s, it is argued, not just by Kelly but also by the Reserve Bank, Productivity Commission and Treasury as well as the IMF and OECD, was a surge in productivity in the 1990s, low inflation and an economy more capable of withstanding sudden external shocks such as the Asian financial crisis of 1997-98.
The final pieces in the “reform” jigsaw came under the Howard government which introduced the GST in 2000 and paid off the public debt. These supposedly simplified the tax system, removed a big interest burden from the Australian public purse and gave the Rudd government the wherewithal to spend billions of dollars to stabilise the economy during the GFC. Rudd’s stimulus package ensured that the economic contraction in Australia was shallow and short-lived and Labor took to the 2013 federal election the proud boast that by comparison with other advanced economies, the Australian economy was significantly larger than it had been at the onset of the GFC in mid-2008.[74]
All in all, the ruling class looks back at economic policy and economic outcomes over the past two decades with a fair degree of self-satisfaction, even if conservative politicians have at times decried “budget emergencies”, “productivity crises” and so forth. In 2010 the Deputy Governor of the RBA, Ric Battellino, described the long run of continuous growth as “a remarkable performance – one that is unprecedented both in Australia’s economic history and among other developed economies over this period.”[75] Not just ruling class figures but many small-l liberal commentators and a few social democrats have joined in the chorus of hosannas, perplexed that the Rudd and Gillard governments were not rewarded with more electoral support for their role in maintaining Australia’s unbroken period of growth in the difficult circumstances of the GFC and its aftermath.[76]
But is this applause justified? In one obvious sense, yes. The capitalist class has prospered since the nadir of its fortunes in the 1970s. The profit share is at its highest for many decades, up from 18 percent in 1983, when the Hawke government was elected, to 27 percent today[77] and the rising mass of profits has helped to push the profit rate up, by one measure to its highest for more than 50 years (see Figure 1, Appendix, p87).[78]
If the capitalists have prospered, however, there is little sign of this generating greater dynamism in the broader Australian economy. Compared to the rapid growth in the 1960s, expansion in the 1990s and 2000s has been pedestrian and pretty much on par with the 1970s and 1980s (Figures 2 and 3, Appendix, pp87-89). And although the dip in GDP associated with the GFC was shallower than the recessions of 1974-75, 1982-83 and 1990-91, the rate of recovery, when measured by GDP per capita, has been slower. In June 2013, GDP per capita was less than 4 percent above its pre-GFC level.[79] This may have been a superior outcome to any of the G7 economies or the euro area, where GDP per capita was still below its pre-crisis levels, but it does not suggest a robust economy.
If gross domestic product, in absolute and per capita terms, and consumer spending have risen only modestly since 1990, gross domestic income has increased more quickly (Figure 3). Chinese economic expansion has been the main factor responsible. The rapid increase in resources and energy prices, driven by Chinese demand, and the cheapening of imported Chinese manufactures have pushed up Australia’s terms of trade, which measures the price of Australian exports relative to the price of imports. Terms of trade peaked in late 2011 at their highest level since the Gold Rush of the 1850s.[80] Simply put, the Australian capitalist class could now earn a much higher income regardless of changes in output, simply because of shifts in relative prices. The result was the surge in gross domestic income accruing to the Australian capitalists in the 2000s evident in Figure 3.
Strong Chinese resources demand has also boosted investment in the resources, energy and allied sectors since 2004. Investment now stands at a historic high of 19 percent share of GDP. Huge sums have been devoted to new mines and gas fields and all of the infrastructure that goes with them, including ports, roads and railways. China has also become a significant investor in the Australian resources and energy sector. Between 2006 and 2012, Chinese companies invested $51 billion in Australia, of which $37 billion went to the mining sector and another $9 billion to gas.[81]
The appreciation of the Australian dollar against most major currencies in recent years, one important product of the resources boom, has had a significant sectoral impact on Australian capitalism, rewarding those capitalists involved in the resources, construction and engineering industries while squeezing the profits of those outside, most obviously in manufacturing, tourism, education and retail.[82]
The fate of Australian manufacturing in recent years has already been considered. Tourism, which boomed in the 1980s and 1990s, has been in deep trouble for a decade. The strong dollar and high costs of accommodation have deterred overseas visitors and encouraged Australians to take holidays in South East Asia rather than at home.[83] Education export earnings which peaked in 2009 have suffered from not just the strong dollar, which makes the sector uncompetitive against its rivals, but also changes to international student visa conditions and damage to Australia’s reputation following exploitation of international students in the vocational sector and well-publicised racist assaults on Indian students.[84] In Semester 1 2013, the number of international student visa holders was substantially lower than three years previously, down from 430,000 to 340,000.[85]
Retail has been hit hard by the strong dollar and the threat from online trading. Department stores, most subject to swings in discretionary spending, have seen their fortunes worsen from year to year but the situation is only moderately better in other segments of the industry. Only food retailing and spending in cafes and restaurants have registered any sustained increases in recent years, the first an unavoidable fixture in household budgets, the second a reflection of the growth of non-standard working hours and the gradual erosion of the social norm of the family dinner.[86]
If different sectors of the capitalist class have seen their fortunes vary, courtesy of the high terms of trade, they have all benefited from the cheapening in the cost of labour, measured in real unit labour costs (see Figure 4, Appendix, p89).[87] The fall in labour costs, and thus an increase in the rate of exploitation, has been driven by different factors at different times.[88] In the 1990s, productivity growth surged, bringing down the cost of labour. From the early 2000s, productivity growth tapered off but real unit labour costs continued to fall, mainly because the producer price index, by which unit costs are deflated, has been rising quite quickly (thanks to the resources boom). Meanwhile, even though nominal wages were rising by no more than 3 or 4 percent on an annual basis through the 2000s, the consumer price index rose more slowly (the terms of trade effect again, as imported household goods are cheapened). This has allowed real unit labour costs to fall, real wages and the rate of profit to rise.
More than two decades of continuous economic growth has had several important outcomes for the working class: increased employment, a fall in the rate of unemployment, a rise in incomes, a lift in inequality and intensified exploitation.
Following the recession and jobless recovery of 1990-93, employment has increased by one half, with female employment rising particularly strongly. Unemployment has fallen from an average of eight percent between 1978 and 1994 to 6.2 percent between 1994 and 2013 and the participation rate (the proportion of the population aged between 15 and 64 in paid employment) rose strongly between 1999 and 2007.[89] In the last five years, however, the situation has been less favourable for workers: growth has come mostly in part-time jobs and the participation rate has pulled back.
If jobs have been a little less difficult to come by than in the 1980s and early 1990s, what of earnings? Figure 5 (Appendix, p90) shows that average employee compensation, having fallen during the Accord years of the 1980s, grew consistently from 1990 until the mid-2000s. During the GFC, real wages fell back but then more than made good the loss in 2010-12.
In a study by the Productivity Commission tracking movements in living standards in recent years, the authors distinguished between incomes from labour and incomes from capital.[90] As we shall see, the distinction is problematic but I will use it in the absence of more reliable data. In what follows I also factor in government transfers and provision of government services.
The 38 percent rise in labour incomes that has occurred since the 1990s was due to two factors: an increase in hourly wages and an increase in hours worked.[91] For full-time workers, real hourly wages grew by 23 percent between 1998-99 and 2009-10, while hours worked changed little.[92] For part-time workers, real hourly wages rose by only 8 percent but working hours increased by 16 percent, up from 17.6 hours to 20.4 hours.[93]
The rise in average incomes derived from labour disguises the fact that some did very well, others rather less so. Official reports simply break up employees by deciles, from the top to the bottom, without reference to social class or the source of their incomes.[94] If, as a crude approximation, we define the top 10 percent of income earners as incorporating the capitalist class and a swag of the better paid middle class – the more prosperous petit bourgeois, upper level managers and professionals – this category of the population saw their “labour incomes” race ahead of everyone else – by 66 percent between 1989 and 2010.[95] The next decile, comprising middle class (and some well-paid working class) employees, saw a rise of a more modest 44 percent. Thereafter, for every subsequent decile the increase in labour earnings, overwhelmingly those of the working class, dropped steadily, bottoming out at only 9 percent for the second decile.[96] Inequality therefore increased, both between the working class and middle and capitalist classes and within the working class itself, even if labour earnings rose across the board.[97]
Wages also rose at quite different rates across industries, reflecting both the weakness of the relevant unions and/or low demand for labour in the industry (Table 1, Appendix, p91).[98]
Wage outcomes varied by occupation, although not by nearly as much. The resources boom saw a strong increase in real wages for machinery operators and drivers and labourers, both up by 23 percent between 1997 and 2011.[99] Increases were highest in WA, much less so elsewhere. Other blue collar workers who saw increases of this order were technicians and trades workers. Community and personal service workers, together with managers and professionals and clerical and administrative workers received similar wage rises (18-21 percent). The outlier was sales workers who saw a much more meagre rise of just 12 percent.[100]
While the resources boom pushed up real wages for many blue collar workers, it is worth putting this into context. It was the bosses who prospered most. In the mining industry, profits produced by each mining worker rose from $131,000 in 2003-04 to $375,000 in 2010-11 and a still healthy $280,000 in 2011-12.[101] In other words, in every 12-hour shift, at least eight hours of produce went back to the mining company in the form of surplus, at most only four hours to the worker. And, for those living in the mining regions but not employed by the industry, the boom squeezed living standards as housing costs became prohibitive – weekly rents of $1,500 for a modest three bedroom house are not unusual in the Pilbara and a caravan park berth can cost up to $1,000.
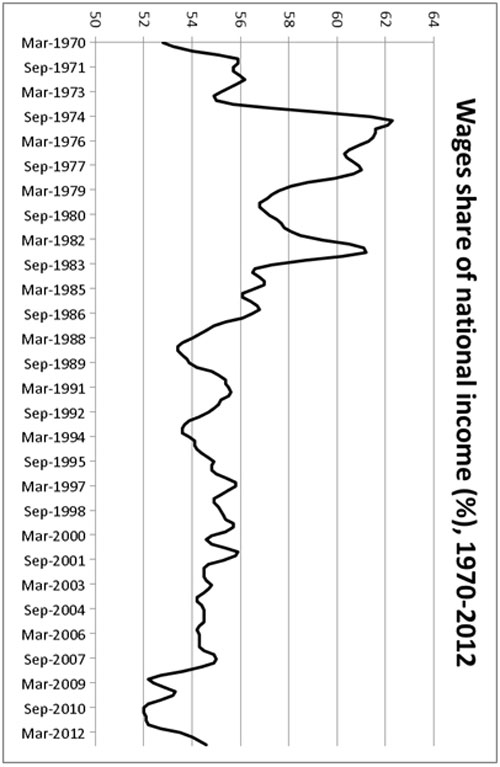
Workers outside the mining industry saw far fewer benefits from the boom than in the last resources boom of 1979-81. In the earlier episode, workers outside the mining industry went on strike in massive numbers to get their share of the increased wealth. Real wages and the wages share of national income rose dramatically (see Figure 6, Appendix, p92). This time around, the unions have been weakened and there has been no wages “breakout”. Indeed, the ACTU regularly boasts of “modest and manageable” wage outcomes and decries any risk of such a breakout as scaremongering.[102]
Employment opportunities and workers’ wages do not tell us everything we need to know about living standards during the past two decades. Workers do not live as atomised individuals, and wages are not their only source of income. Statisticians calculate something called “equivilised final household incomes” (EFHI), which factors in direct government payments, the provision of government-funded services, the impact of taxes and changing household size and composition. In aggregate, EFHI increased by 64 percent in real terms between 1989 and 2010.[103] The rise was due to three factors: a) increased employment – the proportion of adults in paid employment in the average household increased from 56 percent to 60 percent; b) longer working hours among part-time workers; and c) increased hourly wages (as above).[104]
Not all households saw their incomes rise by the same amount, even if the rise in inequality in EFHI was not as great as for individual earnings. The middle deciles (families with one or two waged employees for the most part) saw the smallest increase in their incomes. The upper deciles benefited from rising real salaries and cuts to marginal tax rates.[105] According to one estimate by a former OECD economist, the richest 10 percent of households gained almost 50 percent of aggregate income growth between 1980 and 2008, the top 1 percent, 22 percent.[106]
The lower deciles of households, predominantly comprising those on age pensions, Newstart allowances, disability pensions, supporting parent pensions or part-time work, had a varied experience in the 1990s and 2000s. Overall, those in this category saw bigger increases in their incomes than those in the middle. The drop in unemployment saw the incomes of some households rise sharply as members got work.[107] Age pensioners benefited from the changes to incomes and assets tests by the Howard government and higher pensions introduced by the Rudd government in 2008. Low income households with children benefited from the expansion of Family Tax Benefit by the Howard government. Set against these increases, however, has been the tightening in eligibility for welfare payments and the meagre increases in Newstart and Youth Allowance whose recipients are falling further and further behind average incomes.[108]
Whether on unemployment benefit, parenting payment or disability support pension, many of those dependent on these state payments remain poor – half of those on Newstart in 2006 were living below the poverty line (defined as half of median disposable income), and in total more than 2.2 million people were in this category at that time, including many living in households where at least one person had a job.[109] If the definition of poverty used in the UK and European Union were used in Australia, the number of people in poverty would jump to 3.8 million. For Indigenous people, of course, poverty is chronic and endemic.
The same inequity is apparent with government provision of “indirect benefits” (i.e. government spending on education, health, housing and childcare assistance, as opposed to cash transfers such as pensions). Indirect benefits increased in value by three quarters in real terms between 1993-94 and 2010-11.[110] However, those on higher incomes again benefited disproportionately: the top decile of households consumed about $370 per week of public health and education services, as compared to the bottom decile, predominantly age pensioners, who consumed only $200 (mostly healthcare).[111] Home owners also benefited relative to renters, whether in the private or public sector, from various tax concessions, as did those with hefty superannuation balances.[112]
Another factor that weighs on household living standards is the impact of household debt, which has risen from 40 per cent to 150 percent of GDP between 1985 and 2012. The driving factor has been the doubling of house prices (in real terms) between 1995 and 2012, a trend associated with financial deregulation.[113] Clearly the effect of this debt on households depends on their housing status, with those with large mortgages now taking longer to pay off their mortgages than their parents did.[114]
Rents to private landlords have also increased substantially – by 57 percent in real terms – between 1995 and 2012. The result of these two trends is that it is increasingly difficult for those in the private rental market to save the deposit to buy their own property – the proportion of households renting privately rose from 18 percent to 25 percent between 1995 and 2012.[115] These are disproportionately those on low incomes who pay 30 percent of their gross weekly income in rent to private landlords.
The beneficiaries of these housing trends have been those who have paid off their homes outright, usually the older and wealthier, and who are now using home equity to buy investment properties, taking advantage of the numerous tax advantages afforded to landlords.
Finally, we also have to consider incomes from capital (that is, income from interest, rent and dividends). Here the inequality is most stark: the top 1 percent saw capital income more than double in real terms (to $2,100 per week) between 1988-89 and 2009-10.[116] The top 10 percent notched up an 86 percent increase, while the bottom 60 percent, who only receive on average $35 per week from capital, saw no increase at all.[117] When combining income from both labour and capital, the average incomes of the top one percent rose from eight to 12 times average income between 1990 and 2010.[118]
Another way of measuring rising inequality is by comparing the relative shares of GDP accruing to labour and capital. The labour share was stable in the 1990s but dropped in the 2000s as the profit share surged. This is in line with many other countries. However, the context in Australia has been different to that in the US where workers suffered a similar drop in their share of the pie. In Australia, earnings accruing to both capital and labour were growing through the 2000s at a faster rate than they had in the 1990s, moderating the impact of the redistribution to the bosses: workers were falling behind the capitalists but in a context where wages were rising solidly. In the United States, by contrast, earnings to both were rising more slowly in the 2000s than they had in the previous decade, exacerbating the impact on workers of widening inequality. American workers were now losing out not just in relative terms compared to the bosses but in many cases their absolute living standards.[119] This difference has had important political repercussions for class politics in the two countries, with polarisation rather less evident in Australia.
Even these figures do not convey the enrichment of the fabulously wealthy, the top 0.001 percent. According to Forbes magazine, Australia has seen a big jump in the number of billionaires, from three in 2003 to 17 in 2011, with their collective wealth rising from $5.4 billion to $53.3 billion.[120] The mining boom explains a big part of this jump in wealth, with Gina Rinehart’s wealth rising from $1.8 billion in 2006 to $29 billion in 2012 (before falling back to $22 billion in 2013). Andrew Forrest’s wealth rose in the same period from $1 billion to $3.7 billion, Clive Palmer’s from less than $200 million to more than $2 billion and iron ore heiress Angela Bennett’s from $500 million to $1.5 billion. Even Kerry Stokes, better known for his media assets, saw his wealth inflate (from $2.1 billion to $2.5 billion) courtesy of his Caterpillar franchise which supplies earthmoving and construction equipment to the mining and engineering industry.[121]
The expansionary impact of the resources boom, in terms of investment and employment, now appears to be over, at least in coal and iron ore. In the short term the focus now is on cutting costs as commodity prices have fallen back.[122] Mines slated for development have now been mothballed and new investments are being rapidly scaled back.[123] Mining service companies have already experienced a collapse in new orders, exploration has been cut and a host of companies involved in getting new mines up and running, as well as the companies contracted to build infrastructure, have seen their operations reduced. While investment in new LNG operations is still climbing, it will not be enough to compensate for the pull-back in resources.
With the investment phase of the resources boom being wound back, the prospects for continued growth in the broader economy are thrown into question as the stimulus effects of resources investment, equivalent to 6 percent of GDP, is gradually withdrawn. What will take its place?
One possibility is strong growth in exports as the new mines and gas fields come on stream. There is no doubt that exports will rise fairly strongly in coming years and state governments are forecast to continue to enjoy bumper royalty earnings.[124] However, a range of factors may limit the impact. The first is uncertain conditions in the main Asian markets and the effect of increased supply by Canada, Brazil, Russia and other big resources producers. The second is the potential for demand for Australian energy and resources from the major market, China, to be affected by the switch to less energy- and metals-intensive growth.[125]
However, even if the resources and energy export boom ends up on the high end of projections, its impact on the broader economy will be much less than the investment boom of the 2000s for two reasons. First, the new phase of the boom, which involves digging the resources out of the ground and drilling them from the earth or sea-bed, is much less labour intensive than construction of mines and associated infrastructure. Employment in the sector will contract. Also, the profits and dividends generated by a strong export performance will for the most part be disbursed to foreign shareholders, as foreign ownership predominates in the sector.[126]
If the resources sector in this new phase of the boom is likely to contribute less to the fortunes of Australian capitalism in coming years, will other industries take up the slack? The deprecation in the dollar in the middle of 2013 may create opportunities for industries whose fortunes have been cruelled by the strong currency – manufacturing, tourism, education and retail. However, there is no certainty that the depreciation will be maintained and little evidence yet that these sectors will spring back to life in the next two or three years.[127] At the end of 2013 growth in the Australian economy was limping along at only 2.5 percent and the Reserve Bank wound back its forecasts for 2014.[128]
The main concern of the Australian ruling class is to ensure that the rate of profit on its investments is not hard hit during this adjustment period of slower growth post mining boom. To the extent that the currency depreciates, this will only be a boost to Australian business competitiveness if real wages fall as well. If workers succeed in compensating for increased costs of imported goods by squeezing higher wages out of the bosses, any competitive edge vanishes.
The ideological representatives of big business have sallied forth with their respective “reform agendas” to confront these new challenges. The Business Council tabled its log of claims on the government in the middle of 2013: reduce company taxes, raise the GST, cut business regulation, trim minimum wages and penalty rates, reintroduce statutory individual contracts, increase free trade and boost productivity by expanding worker skills.[129] The Grattan Institute likewise argued that urgent measures were needed to tackle what it called a public debt “overhang” of 4 percent of GDP, or $60 billion, every year over the next decade. Its proposed measures clearly target the working class:
Since health, welfare and education dominate Australian government expenditure, it will be hard to reduce future deficits without substantial reforms in these areas. They are obviously politically sensitive, but Australian governments have few other choices.[130]
Ross Garnaut, ANU professor and senior policy advisor to a string of governments, identifies “broadly based income restraint”, “uninhibited pursuit of productivity growth”, “reform of middle class welfare without reducing incentives for participation” and “economically efficient environmental policies” as the main issues that need addressing if Australia is to continue growing, while Don Argus, former chairman of BHP Billiton, complains that spending on health and pensions is unsustainable: “We need a national conversation about our welfare budget and how it could be better calibrated for the challenging period ahead.”[131]
The ruling class agenda is clear. Rudd and Gillard did their best to oblige and the Abbott government is no different. Even though the situation is not the same as that which confronted Kennett and Howard in the 1990s when they took office, with the economy today in much better shape and enjoying an extended period of economic growth, the same neoliberal program is still in place. While the pace of attacks will not be as frenetic, the Commission of Audit set up by the Abbott government soon after taking office, chaired by Business Council chief Tony Shepherd, will no doubt urge Treasurer Joe Hockey to undertake surgery on the public sector. The Productivity Commission will soon be initiating a “review” of industrial relations, at the behest of Eric Abetz, while state governments across the country have cut jobs, weakened public sector workers’ conditions, expanded outsourcing and sold off public assets.
It is not just governments on the attack. Workers in manufacturing face insistent pressure. The failure of the union leaders to mount any serious campaign to defend jobs will only encourage the bosses to continue their attacks on jobs, wages and conditions. Unemployment is already inching up to 6 percent and in real terms would be higher if the participation rate had not fallen in recent years.[132] On top of those unemployed, nearly one million workers are underemployed, that is, in work but with fewer hours than they wish for. At nearly 8 percent of the total workforce, underemployment now stands at a record high.[133]
From a Keynesian perspective, the kind of public sector cuts that have already taken place and which are in train for the next three years appear counterproductive as they suck spending power from a slowing economy. But from the bosses’ point of view, public sector cuts make perfect sense as they cheapen the cost of labour and allow for cuts in business taxes. If in the short term, this depresses markets, this is only temporary compared to the longer term benefits that the bosses reap.
It is testament to the brutality of capitalism that Australia is now in its twenty-second year without recession, during which time GDP has grown substantially and the country has become, by one measure, the wealthiest country in the world, and yet more than 700,000 people are still unemployed and more than two million live in poverty. The phenomenon of workers having to take on two and sometimes three jobs to afford home repayments is becoming more common and the number of older workers entering retirement with a mortgage debt still outstanding is rising.
The notion of public sector job security has long gone in this age of outsourcing, privatisation and cutbacks. In the midst of plenty and a steady rise in the number of millionaires, single mothers are being pushed into poverty because of cuts to welfare and the universities are cutting courses and staff. Many young people today will never own their own home and are burdened by escalating HECS debts and precarious employment. Australian capitalism cannot provide for the needs of the majority even when it is allegedly in the best shape it has ever been, an indictment of its cruel logic and the basis for future struggles to challenge it on every front.
Figure 1: The rate of profit in Australia (with inventories)[134]
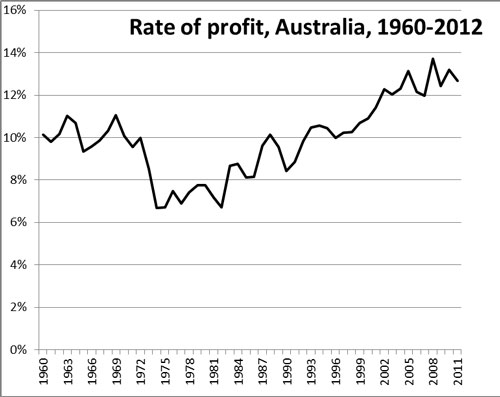
Figure 2: Real GDP growth, 1960-2011[135]
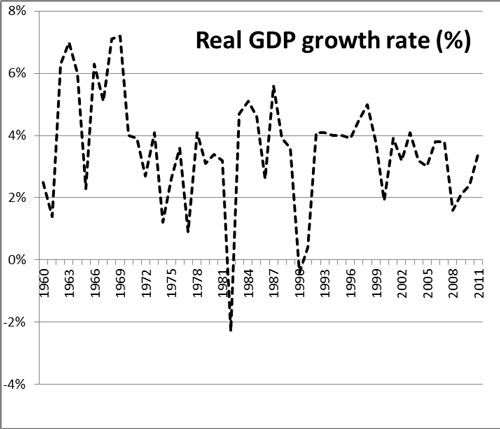
Figure 3: Real growth in the Australian economy
(% per annum, averaged), 1960-2012[136]
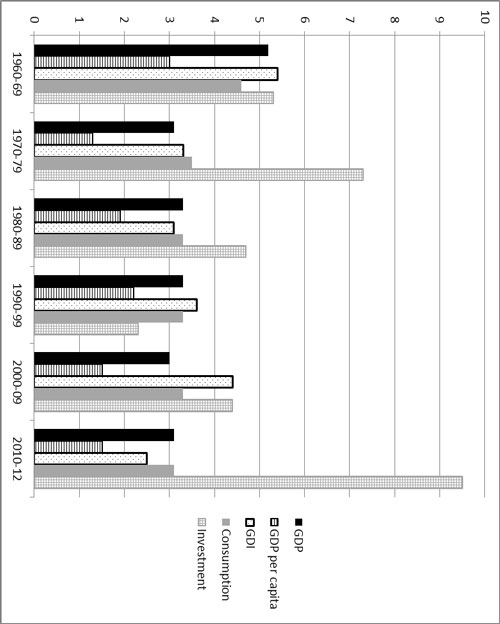
Figure 4: Real unit labour costs, 1985-2012[137]
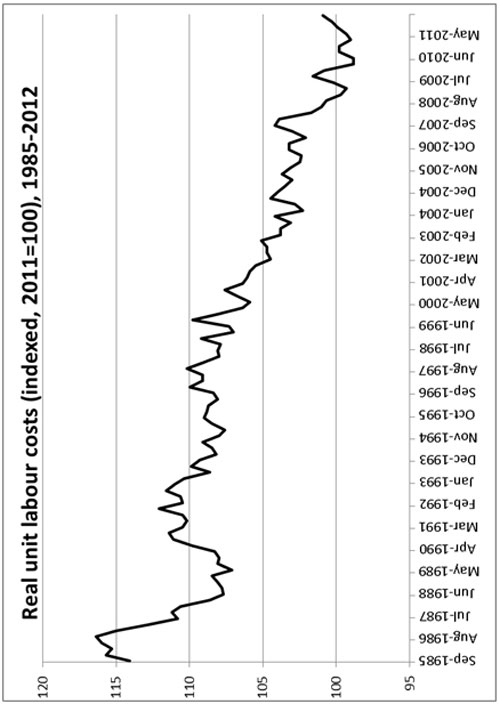
Figure 5: Average employee compensation, 1978-2012[138]
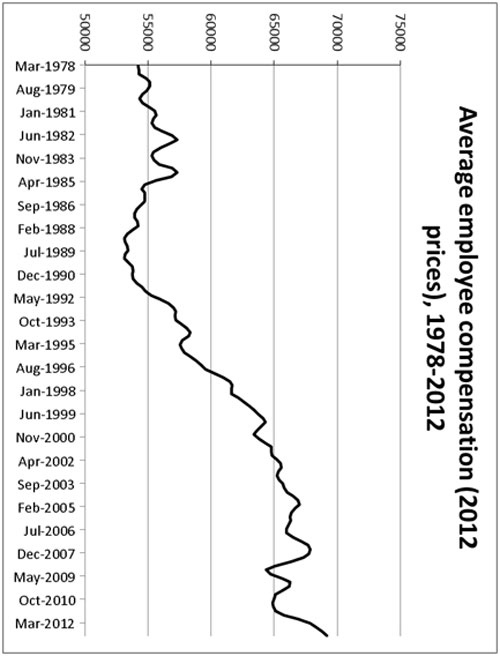
Table 1: Ordinary hourly rates of pay (excluding bonuses),
public and private sectors, 1998-2012, in real terms[139]
|
Industry sector |
% change, 1998-2012 |
|
Electricity, gas and water services |
16.0 |
|
Mining |
14.3 |
|
Professional, scientific and technical services |
13.4 |
|
Education and training |
13.0 |
|
Construction |
12.9 |
|
Public administration and safety |
8.4 |
|
Financial and insurance services |
7.1 |
|
Health care and social assistance |
5.0 |
|
Manufacturing |
1.3 |
|
Rental, hiring and real estate services |
0.3 |
|
Transport, postal and warehousing |
-1.1 |
|
Administrative and support services |
-1.6 |
|
Wholesale trade |
-1.8 |
|
Information media and telecommunications |
-2.4 |
|
Arts and recreation services |
-3.6 |
|
Other services |
-6.7 |
|
Retail trade |
-7.2 |
|
Accommodation and food services |
-11.7 |
|
ALL INDUSTRIES |
4.0 |
Figure 6: Wages share of national income, 1970-2012[140]
ABS, 2013a, Australian National Accounts: National Income, Expenditure and Product, December 2012, cat. no. 5206.0.
ABS, 2013b, Labour Force, Australia, Detailed, Quarterly, cat. no. 6291.0.55.03, February 2013.
ABS, 2013c, Australian National Accounts: National Income, Expenditure and Product, June 2013, cat. no. 5206.0.
ABS, 2013d, International Trade in Goods and Services, Australia, August 2013, cat. no. 5368.0.
ABS, 2013e, International Trade in Services, by Country, by State, 2012, cat. no. 5368055004.
ABS, 2013f, Retail Trade, Australia, August 2013, cat. no. 8501.0.
ABS, 2013g, International Investment Position, Australia, Supplementary Statistics, 2012, cat. no. 53520.
ABS, 2013h, Employment and Earnings, Public Sector, Australia, 2011-12. cat. no. 6248.0.
ABS, 2013i, Prisons in Australia, 2012, cat. no. 45170DO001.
ABS, 2013j, Employee Earnings, Benefits and Trade Union Membership, Australia, August 2012, cat. no. 6310.0.
ABS, 2013k, Australian System of National Accounts, cat. no. 5204.0.
ABS, 2013l, Labour Force, Australia, August 2013, cat. no. 6202.0.
ABS, 2013m, Wage Price Index, Australia, March 2013, cat. no. 6345.0.
ABS, 2013n, Housing Occupancy and Costs, 2011-12, cat. no. 4130.0.
ABS, 2013o, Labour Force, Australia, June 2013, cat. no. 6202.0.
Australian Council of Social Services (ACOSS), 2011, Poverty Report, October 2011 Update, ACOSS, http://acoss.org.au/images/uploads/ ACOSS_Poverty_October_2011.pdf.
Australian Council of Trade Unions, 2011: “Wages breakout? What wages breakout? Latest ABS data confirms cost of living pressures for workers”, press release, 16 November 2011, Melbourne, http://www.actu.org.au/Media/Mediareleases/WagesbreakoutWhatwagesbreakoutLatestABSdataconfirmscostoflivingpressuresforworkers.aspx.
Australian Education International, 2013, “Export income to Australia from international education activity in 2012”, https://aei.gov.au/research/ Research-Snapshots/Documents/Export%20Income% 202012.pdf.
Australian Government, 2012, Australia in the Asian Century White Paper, http://pandora.nla.gov.au/pan/133850/20130914-0122/asiancentury. dpmc.gov.au/white-paper.html.
Battellino, Ric, 2010, “Twenty Years of Economic Growth”, Address to Moreton Bay Regional Council, Redcliffe, Queensland – 20 August”, Reserve Bank of Australia, http://www.rba.gov.au/speeches/ 2010/sp-dg-200810.html.
Bowen, Chris, 2013, “Economic Note”, number 3, 28 July 2013, http://ministers.treasury.gov.au/DisplayDocs.aspx?doc=economicnotes/2013/003.htm&;pageID=012&min=cebb&Year=&DocType=4.
Bramble, Tom, 2011a, “Australian imperialism and the rise of China”, Marxist Left Review, 3, Spring.
Bramble, Tom, 2011b, “Does the Australian working class have the power to change society?”, Marxist Left Review, 2, Autumn.
Bramble, Tom, 2013, “How Australia’s mining barons stole the boom”, Red Flag, 6, 21 August.
Bureau of Resources and Energy Economics, 2013a, Resources and Energy Quarterly, BREE, Canberra, June.
Bureau of Resources and Energy Economics, 2013b, Resources and Energy Major Projects, BREE, Canberra, April.
Business Council of Australia, 2013a, Action Plan for Enduring Prosperity, BCA, Melbourne.
Business Council of Australia, 2013b, Securing Investment in Australia’s Future: Managing the Economic Transition, BCA, Melbourne.
Chesters, Jenny, 2013, “The rise of China and the formation of a transnational capitalist class in the Asia/Oceania region”, paper presented to the Global Capitalism in Asia and Oceania conference, Brisbane, 28-29 June.
Connelly, Stephen and Alan Olsen, 2012, “Education as an export for Australia: more valuable than gold, but for how long?”, paper presented to the Australian International Education Conference, Melbourne, 5 October 2012, http://www.spre.com.au/download/AIEC2012IEAA Paper.pdf.
Connolly, Ellis and Christine Lewis, 2010, “Structural Change in the Australian Economy”, Reserve Bank of Australia Bulletin, September quarter 2010, Sydney.
Daley, John, 2013, Budget pressures on Australian governments, Grattan Institute Report 2013-4, April 2013.
Demographia, 2013, 9th Annual Demographia International Housing Affordability Survey: 2013, http://www.demographia.com/dhi.pdf.
Denniss, Richard, 2013, “Fantasy budget Richard Denniss would cut from the rich”, The Australia Institute, 10 May 2013, http://www.tai.org.au/ content/fantasy-budget-richard-denniss-would-cut-rich.
Department of Immigration and Citizenship (DIAC), 2013a, Working Holiday Maker visa program report, 30 June 2013, Canberra.
DIAC, 2013b, Student visa program quarterly report, 30 June 2013, Canberra.
Department of Immigration and Border Protection, 2013, Subclass 457 quarterly report, Quarter ending at 30 September 2013, Canberra.
Department of Industry, 2013, Key Automotive Industry Statistics 2012, Australian Government, Canberra.
Edwards, Naomi, 2011, “Foreign ownership of Australian mining profits: Now are we selling the farm?” paper prepared for The Australian Greens, http://www.sciencemedia.com.au/downloads/ 2011-6-29-3.pdf.
Frijters, Paul and Bob Gregory, 2006, “From Golden Age to Golden Age: Australia’s ‘Great Leap Forward’?”, Economic Record, 82, 257.
Garnaut, Ross, 2013, “Managing the end of Australia’s China resources boom”, Trade & Development Seminar, ANU College of Asia and the Pacific, Canberra, 16 April.
Greenville, Jared, Clinton Pobke and Nikki Rogers, 2013, Trends in the distribution of income in Australia, Productivity Commission Staff Working Paper, March, Productivity Commission, Canberra.
Gregory, R.G., 2011, Living Standards, Terms of Trade and Foreign Ownership: Reflections on the Australian Mining Boom, ANU Centre for Economic Policy Research Discussion Paper 656, December, Australian National University, Canberra.
Grudnoff, Matt, 2013, Pouring more fuel on the fire: The nature and extent of federal government subsidies to the mining industry, Policy Brief no. 52, June, The Australia Institute, Canberra.
Gruen, David, 2011, “The resources boom and structural change in the Australian economy”, a presentation at the Committee for Economic Development of Australia Economic and Political Overview, Melbourne, 24 February, http://www.treasury.gov.au/PublicationsAnd Media/Publications/2011/Economic-Roundup-Issue-2/Report/The-resources-boom-and-structural-change-in-the-Australian-economy.
Harris, Anthony, 2013, “Things you should know about private health insurance rebates”, The Conversation, 1 July, https://theconversation. com/things-you-should-know-about-private-health-insurance-rebates-15560.
Jones, Peter, 2013, “The global economic crisis: is there any end in sight?”, talk given at the Marxism conference, Melbourne, March 2013, http://redbookreports.tumblr.com/post/47133126869/ guest-post-the-global-economic-crisis-is-there-any.
Keen, Steve, 2013, “The housing bubble Whodunit”, Business Spectator, 4 November.
Kelly, Paul, 1992, The End of Certainty, Allen and Unwin.
Kelly, Paul, 2009, March of the Patriots, Melbourne University Press.
KPMG, 2013, Demystifying Chinese Investment in Australia, KPMG-The University of Sydney, March.
Mares, Peter, 2009, “The permanent shift to temporary migration”, Inside Story, http://inside.org.au/the-permanent-shift-to-temporary-migration/.
Mares, Peter, 2012, “Temporary Migration and its Implications for Australia”, Papers on Parliament, no. 57, http://www.aph.gov.au/About_ Parliament/Senate/Research_and_Education/pops/pop57/~/~/link.aspx?_id=06B96F584FD0483D9F369F0B5186C6A9&_z=z.
McLean, Ian, W., 2013, Why Australia Prospered: The Shifting Sources of Economic Growth, Princeton University Press.
Mikler, John, 2012, “Still stalled on the road to neoliberal globalization? The endurance of national varieties of capitalism”, in Damien Cahill, Lindy Edwards and Frank Stilwell (eds), Neoliberalism: Beyond the Free Market, Edward Elgar.
Minifie, Jim, 2013, The Mining Boom: Impacts and Prospects, Grattan Institute Report 2013-9, July, Melbourne.
Mitchell, Alex, 2012, “Lobbying for the dark side”, Meanjin, 71 (2), Winter issue.
Norton, Andrew, 2006, “The rise of Big Government conservatism”, Policy, 22 (4).
Organisation for Economic Cooperation and Development (OECD), 2011, Education at a Glance, 2009, Paris.
OECD, 2013, StatExtracts website, www.stats.oecd.org.
Parham, Dean, 2013, “Labour’s Share of Growth in Income and Prosperity”, Visiting Researcher Paper, Productivity Commission, Canberra.
Parliament of Australia, 2013, Private Health Insurance Legislation Amendment (Base Premium) Bill 2013.
Passant, John, 2013, “The minerals resource rent tax: the Australian Labor Party and the continuity of change”, paper presented to the Australian Political Studies Association conference, Perth, October 2013, http://ssrn.com/abstract=2352345.
Phillips, Ben and Binod Nepal, 2012, “Going Without: Financial Hardship in Australia”, report prepared for Anglicare Australia, Catholic Social Services Australia, The Salvation Army and UnitingCare Australia, NATSEM, University of Canberra.
Productivity Commission, 2012, Report on Government Services, 2012, Canberra.
Reserve Bank of Australia, 2013a, Exchange rate data, http://www.rba.gov.au/statistics/hist-exchange-rates/index.html.
Reserve Bank of Australia, 2013b, Statement on Monetary Policy, November 2013, http://www.rba.gov.au/publications/smp/2013/ nov/pdf/1113.pdf.
Richardson, D., 2012, The rise and rise of the big banks: Concentration of ownership, Technical Brief No. 15, The Australia Institute, Sydney.
Ross, Liz, 2011, “Dealing with Climate Change”, Marxist Left Review, 3, Spring.
Schwartz, Herman, 2006, “Explaining Australian economic success: good policy or good luck?”, Governance: An International Journal of Policy, Administration and Institutions, 19, 2.
Shomos, Anthony, Erin Turner and Lou Will, 2013, Forms of Work in Australia, Productivity Commission Staff Working Paper, Australian Government, April 2013, Canberra.
Thurbon, Elizabeth, 2012, “Ideas and industrial governance: has the influence of neoliberalism been overstated?”, in Damien Cahill, Lindy Edwards and Frank Stilwell (eds), Neoliberalism: Beyond the Free Market, Edward Elgar, Cheltenham.
Treasury, 2013, Tax Expenditures Statement 2012, Canberra.
Van Onselen, Leith, 2013a, “Population growth juices Australian GDP”, Macro Business, 5 September, http://www.macrobusiness.com.au/ 2013/09/population-growth-juices-australian-gdp/.
Van Onselen, Leith, 2013b, “Inbound and outbound tourism set new records”, Macro Business, 7 February, http://www.macrobusiness. com.au/2013/02/inbound-and-outbound-tourism-set-new-records/.
World Bank, 2013, World Development Indicators, http://data.worldbank. org/data-catalog/world-development-indicators.
[1] The focus is mainly on the narrowly economic dimensions of this question. The military considerations facing Australian capitalism are discussed in Bramble, 2011a.
[2] Frijters and Gregory, 2006; Schwartz, 2006.
[3] Connolly and Lewis, 2010.
[4] Australian Bureau of Statistics (ABS), 2013a, Table 6. Industry value added measures industry outputs less inputs. There are obvious problems with these data: finance and insurance, for example, do not in any real sense add value but these data will have to suffice for our purposes as an indication of the significance of various sectors.
[5] ABS, 2013b.
[6] ABS, 2013a, Table 6.
[7] ABS, 2013a, Table 7.
[8] Commonwealth Bank, National Australia Bank, Westpac and ANZ.
[9] Richardson, 2012.
[10] Richardson, 2012.
[11] Keen, 2013; Demographia, 2013.
[12] Michael West, “Banking boom takes an easy ride on taxpayer guarantee”, Sydney Morning Herald, 16 September 2013.
[13] Treasury, 2013, p4.
[14] Treasury, 2013, p4.
[15] Parliament of Australia, 2013.
[16] Harris, 2013.
[17] I discuss the mining boom in more detail in Bramble, 2013.
[18] ABS, 2013a, Table 6.
[19] Bureau of Resources and Energy Economics, 2013a.
[20] Bureau of Resources and Energy Economics, 2013a.
[21] Grudnoff, 2013.
[22] Grudnoff, 2013.
[23] Grudnoff, 2013.
[24] Mitchell, 2012, Passant, 2013.
[25] Passant, 2013.
[26] Ross, 2011.
[27] McLean, 2013, p181.
[28] ABS, 2013a, Table 6.
[29] All figures from OECD, 2013.
[30] OECD, 2013.
[31] ABS, 2013a, Tables 37 and 39. In 2012, output was higher than in 1978 in machinery and equipment (up by 90%), metal products (88%), non-metallic mineral products (85%), printing and recorded media (77%), food, beverage and tobacco (58%) and wood and paper products (8%).
[32] Department of Industry, 2013.
[33] Department of Industry, 2013.
[34] ABS, 2013c, Table 21. State final demand is calculated from consumption, investment spending and government spending.
[35] ABS, 2013d, Table 15a. The actual shares were WA, 46.5%, Queensland, 16.2%. They were followed by NSW at 13.9% and Victoria at just 8.4% of the total. The shares of the much smaller services trade were skewed more in favour of the traditional economic leaders: NSW, 40.0% and Victoria, 24.2% in 2012. ABS, 2013e, Table 2.14.
[36] ABS, 2013b.
[37] ABS, 2013b.
[38] I consider these issues in more depth in Bramble, 2011b.
[39] Unfortunately, with changing occupational categories used by the ABS, it is impossible to get comparable occupational data for a longer time period than this.
[40] Shomos, Turner and Will, 2013, p39.
[41] Shomos et al, 2013, p38.
[42] McLean, 2013, p222.
[43] McLean, 2013, p222.
[44] Effective rates of assistance to manufacturing dropped from 33 percent in 1972 to 5 percent in 2010. Connolly and Lewis, 2010. These figures, however, do not capture all government subsidisation to industry and actual government assistance to industry in Australia remains high, as indicated elsewhere in this article.
[45] ABS, 2013a, Table 20; ABS 2013f.
[46] Connolly and Lewis, 2010.
[47] OECD, 2011. The runners-up were the UK, New Zealand, Switzerland and Austria, all on 15 percent, followed by Canada on 6.5 percent, the US on 3.5 percent and Japan at 3.1 percent.
[48] Australian Education International, 2013.
[49] Connelly and Olsen, 2012.
[50] ABS, 2013g, Tables 2 and 5. The biggest destinations for Australian overseas investment were the US ($434 billion), the UK ($218 billion), New Zealand ($77 billion), Canada and Germany (more than $40 billion) and France, Japan, Singapore, Holland and Hong Kong (between $26 billion and $39 billion). ABS, 2013g, Table 5.
[51] Australian Government, 2012.
[52] This figure excludes temporary migrants such as international students. Department of Immigration and Citizenship, Immigration Update, various issues.
[53] This has long been the case. Canada has now nearly caught up with Australia, but other major countries are well behind. They include the US (13.8%), Germany (13.2%), the UK (10.4%), France (10.3%) and Japan (1.7%). World Bank, 2013.
[54] OECD, 2011, p329.
[55] Mares, 2012.
[56] Mares, 2009.
[57] DIAC, 2013a.
[58] Mares, 2012.
[59] DIAC, 2013a.
[60] Department of Immigration and Border Protection, 2013.
[61] Mares, 2012.
[62] World Bank, 2013.
[63] Australia is by no means alone in this respect. Across the OECD, government expenditure as a share of GDP was more or less constant between 1995 and 2008. Mikler, 2012.
[64] Norton, 2006.
[65] Thurbon, 2012, pp192-93.
[66] ABS, 2013h.
[67] Productivity Commission, 2012, Tables 6A1-4; ABS, 2013i.
[68] ABS, 2013h. Total public sector employment in this same period grew from 1.75 million to 1.89 million.
[69] ABS, 2013h. Union coverage among public sector workers in 2012 stood at 43 percent; in the private sector the figure was only 13 percent. ABS, 2013j.
[72] Stephen Koukoulas, “Australia’s stocktake reveals a healthy ledger”, Business Spectator, 22 May 2013, http://www.businessspectator.com.au/article/2013/ 5/22/economy/australias-stocktake-reveals-healthy-ledger. See also Gregory, 2011 for more of this nature.
[73] Kelly, 1992; Kelly, 2009.
[74] Bowen, 2013.
[75] Battellino, 2010.
[76] Business journalist Stephen Koukoulas has been particularly vocal on this theme, but see also Joseph Stiglitz, “Australia, you don’t know how good you’ve got it”, Sydney Morning Herald, 2 September 2013; Scott Steel (aka Possum Comitatus), “Australian exceptionalism”, Crikey, 8 December 2011; and Paola Totaro, “Australians don’t know how lucky they are”, The Guardian, 21 March 2013.
[77] ABS, 2013a, Table 20.
[78] Jones, 2013. Jones’s alternative calculation for the rate of profit, excluding inventories, gives a different reading, with the rate of profit in the 2000s and 2010s still lower than the figure recorded in the 1960s but substantially higher than in the 1980s. It should be noted that accurately assessing trends in the rate of profit in Australia is still very much a work-in-progress (private communication with Peter Jones).
[79] Van Onselen, 2013a.
[80] Gruen, 2011.
[81] KPMG, 2013.
[82] The Trade Weighted Index, which measures the value of the Australian dollar against the currencies of its major trading partners, tracked between 50 and 60 from 1986 to 2003, since which time it has been moving between 70 and 80 (1970=100). Reserve Bank of Australia, 2013a.
[83] The ratio of international tourist arrivals to departures, which fluctuated between 130 and 150 percent between 1994 and 2004, slid to just 75 percent in 2012. Van Onselen, 2013b.
[84] Australian Education International, 2013; Glenda Kwek, “Australia the world’s most expensive destination for international students”, Sydney Morning Herald, 13 August 2013; Connelly and Olsen, 2012.
[85] DIAC, 2013b.
[86] ABS, 2013f.
[87] Real unit labour costs capture the average labour cost to producers of producing a unit of output, deflated over time by the price index. It is defined as average labour costs divided by average labour productivity. Real unit labour costs therefore depend on the interplay of three variables: nominal wage levels, productivity rates and the price level. Other things being the same, higher nominal wages would raise real unit labour costs, while higher productivity and higher prices would reduce them. Shomos et al, 2013, p43.
[88] Shomos et al, 2013.
[89] ABS, 2013l.
[90] Greenville, Pobke and Rogers, 2013.
[91] Greenville et al, 2013, p31.
[92] Greenville et al, 2013, p49.
[93] Greenville et al, 2013, p29.
[94] A decile is an interval of 10 percentage points in a distribution. The first decile is the lowest 10 percent in an income distribution from bottom to top, the tenth is the highest.
[95] Greenville et al, 2013, p33. Incomes expressed in constant 2012 prices. “Incomes from labour” here is used only to differentiate the salaries and bonuses of the top decile from that part of their incomes generated by their ownership of capital in the form of dividends, interest, rents etc. What the Productivity Commission calls “incomes from labour” for those in the top decile are, in practice, better understood as incomes from capital since these individuals do not labour in the sense of contributing to the creation or realisation of surplus value but rather derive their incomes from surplus value generated by others.
[96] The bottom decile, 70 percent of whom are part-time employees, saw a rise of 33 percent, mainly due to an increase in hours worked.
[97] Greenville et al, 2013, p29. The Gini coefficient increased from 0.35 to 0.41 between 1988 and 2010. This coefficient is a measure of inequality: a value of 0 implies perfect equality, a value of 1, perfect inequality.
[98] The data in Table 1 are not comparable to the figures sourced above as they are calculated in different ways. The point of the table is to indicate the disparity in outcomes between industries rather than to draw definite conclusions about the absolute rise or fall in hourly earnings in particular sectors.
[99] Minifie, 2013, p17. The same point concerning absolute changes in earnings raised in the above footnote applies here also.
[100] Minifie, 2013, p17.
[101] Bureau of Resources and Energy Economics, 2013a, pp97-98.
[102] Australian Council of Trade Unions, 2011.
[103] Greenville et al, 2013, p4.
[104] Greenville et al, 2013, p5.
[105] The impact of cuts to marginal tax rates for the well-off is substantial. The top 10 percent of income earners received tax cuts to the value of $16 billion in the Rudd government’s first budget (tax cuts first proposed by Howard and carried over by Rudd). This was more than the bottom 80 percent combined. Denniss, 2013.
[106] Tim Colebatch, “Country’s rich have lion’s share of income growth”, Sydney Morning Herald, 10 October 2013. This estimate by the retired OECD economist John Martin was provided in the annual Max Corden lecture at Melbourne University on 10 October 2013. The presentation is not available.
[107] Greenville et al, 2013, p96.
[108] Phillips and Nepal, 2012.
[109] ACOSS, 2011, p2.
[110] Greenville et al, 2013, p13.
[111] Daley, 2013, p43.
[112] Peter Martin, “More home subsidies go to rich than renters”, Sydney Morning Herald, 21 October 2013; John Passant, “Super tax breaks yield more to the already rich”, Canberra Times, 12 February 2013.
[113] ABS, 2013n.
[114] The proportion of Australians who owned their homes outright fell from 42 percent in 1994 to 31 percent in 2012. ABS, 2013o.The reduction is due to two quite different trends: first, the fact that relative to incomes mortgages are now much larger than two decades ago; second, the increase in mortgagees with substantial home equity using this equity to buy investment properties or shares, thereby extending the life of the mortgage but also involving accumulation of financial assets.
[115] ABS, 2013o.
[116] Greenville et al, 2013, p52. This figure dramatically understates the actual incomes from capital received by the top 1 percent given the various means used to understate such incomes to the Tax Office.
[117] Greenville et al, 2013, p52.
[118] Daley, 2013, p39.
[119] Parham, 2013, pp39-47.
[120] Chesters, 2013, pp8 and 16.
[121] Chesters, 2013, pp8 and 16.
[122] Angela Macdonald-Smith, “Rio’s Walsh pledges more on costs, debt”, Australian Financial Review, 9 August 2013.
[123] Bureau of Resources and Energy Economics, 2013b.
[124] Andrew Burrell, “Poll winner to bank LNG, iron ore prize”, The Australian, 6 September 2013.
[125] Garnaut, 2013; Lisa Murray, “China overhauls energy mix to tackle pollution problem”, Australian Financial Review, 13 September 2013.
[126] Foreign ownership accounts for three quarters of the share register of BHP-Billiton, 83 percent of Rio Tinto and 100 percent of Xstrata. Edwards, 2011; Gregory, 2011, pp22-25.
[127] Reserve Bank, 2013b.
[128] Reserve Bank, 2013b.
[129] Business Council of Australia, 2013a, 2013b.
[130] Daley, 2013, p52.
[131] Garnaut, 2013; Annabel Hepworth, “Cut welfare ‘to protect our future’, says Don Argus”, The Australian, 23 February 2013.
[132] ABS, 2013o.
[133]ABS, 2013l, Table 22.
[134] Jones, 2013.
[135] Jones, 2013.
[136] ABS, 2013a, Tables 1, 8 and 20; ABS, 2013k, Table 1.
[137] ABS, 2013a, Table 38.
[138] ABS, 2013a, Table 20.
[139] ABS, 2013m, Table 8a. Nominal figures have been deflated by a CPI increase of 60.3% between June 1998 and June 2012.
[140] ABS, 2013a, Table 20.