Issue
How we stopped Pauline Hanson last time
Playback speed:
Since the early years of colonial occupation, Australia has been integrated into the world division of labour primarily through the export of primary products – wool, meat and wheat grown on the continent’s vast inland basins and minerals looted from some of the world’s largest deposits. The combination of a small (European) population and immense natural resources produced, in a relatively short space of time, a high income economy with a high ratio of exports and imports relative to GDP,[2] a high dependence on foreign capital inflow and sensitivity to world prices; a rich economy that could become heavily indebted in boom times, suffer more keenly than the rest of the world in the downturns and then recover more slowly.[3]
During the first half of the twentieth century, the economy diversified under tariff and quota protection from international competition and became less reliant on primary exports for income. From the 1970s, exploitation of natural resources increased and the economy gradually re-internationalised as protection for domestic industries was reduced. In recent years, the economy has again become more dependent on exports of primary products, although not as much as in the nineteenth and the first half of the twentieth centuries. After one of the largest mining booms in history, Australia is now in a new transition.
The following will sketch the development of the Australian mining industry and the broader division of labour in the national economy to help frame the twenty-first century boom and the challenges of the transition. I will make a series of points: that the current establishment preoccupation with “innovation” reflects capital’s need for increased productivity compared to countries with which Australian capitalists compete in domestic or international markets; that the scope for success in this endeavour is limited by important features of the Australian economy; that successive governments have allowed income from the mining boom to flow to wealthy individuals at the expense of domestically oriented industries and the working class, and that Australian capitalism is more exposed to external shocks as a result; and that, without substantial productivity gains, the main emphasis in policy is likely to be reducing the cost of labour.
On a number of occasions, resource booms have transformed the Australian landscape, literally and economically. They had different characteristics, came at different stages in the development of Australia’s division of labour and left different legacies.

The first was the 1850s gold rush in Victoria. Unlike most other commodities, gold always finds a buyer. Primarily, this is because gold was money. So a sudden injection into the world market of this non-renewable resource that, in the early Victorian boom required little investment to find (the gold fields were rich in alluvial gold and deposits close to the surface that many non-skilled workers could obtain with little equipment but a lot of luck) allowed huge international transfers of wealth into the country. In the boom years, the colony was producing one-third of the world’s gold, almost all of it exported to Europe.[4] The mining industry’s share of the continent’s GDP peaked at more than one-third and the employment share at more than 17 percent.[5] In Victoria the employment share peaked at 31 percent.[6]
This first rush was transformative in several ways. The non-indigenous Victorian population swelled from fewer than 100,000 in 1851, to around 540,000 ten years later.[7] Within 25 years of its establishment, Melbourne was larger than Chicago. At this point the overwhelming majority of the proceeds were retained by individual prospector-miners, rather than being transferred to overseas owners of companies, as is more the case today. Surging colonial revenues allowed for the paving of roads and construction of wharves, bridges and municipal buildings. Private companies built metro rail lines from the city to Port Melbourne, followed by lines to St Kilda, Hawthorn, Brighton, Flemington and Essendon. The booms in exports and imports of capital, consumer goods and people laid the basis for Melbourne’s financial and manufacturing supremacy over the following decades – a position further cemented by minerals booms in other colonies, which were often managed from Melbourne’s Collins Street.[8]
Yet there was no industrial transformation. The rush did lead to the expansion of a range of manufacturing that directly serviced the growing population – furniture trades and building materials, clothing and textiles, food and tobacco, and also metals and machinery.[9] But mining at this early stage was labour intensive and dominated by individual prospectors with basic equipment. And it was incredibly difficult for small local firms to produce wares that could compete with a mass of imported goods from much larger and more productive enterprises in Britain. As historian Geoffrey Serle noted:
Manufacturing, which developed to a limited extent from 1856, was still confined almost entirely to those products which were naturally protected or were readily served by local raw materials, for Victoria’s high wage rates as well as the inefficiency of infant industries made it almost impossible to compete with nearly all imports… Only about 3,000 men were working in factories by 1861.[10]
The dramatic rise in Victorian incomes pushed up prices, expanded credit from Britain and in Melbourne created a speculative property bubble. The value of imports almost quadrupled from 1852 to 1853. By the end of 1854, £33 million of gold had been extracted, yet the economy was importing more than it was exporting and the year ended with a balance of payments crisis, widespread business insolvencies, rising unemployment and a property market crash. The glut of imports produced deflation; prices fell and wages fell faster. There was recovery in 1856, but it was short lived. “[F]rom now on”, wrote Serle, “‘depression’ was the constant talk”.[11]
A series of mining booms followed the Victorian rush, peaking in the 1890s and into the twentieth century. In terms of employment and share of GDP, they didn’t rival the 1850s rush, but eclipsed it in terms of the absolute amount of capital investment and output. The effects again were transformative, with value being distributed to other industries across the economy. In the late 1860s a string of finds in Queensland drew thousands of prospectors and laid the basis for towns, ports and commerce all along the Pacific coast. After Queensland came Western Australia. Discoveries were made in the Kimberley, and within a decade prospectors had pushed south, first to the Pilbara, then to Geraldton, then to Perth and east to Southern Cross, Coolgardie and Kalgoorlie in the 1880s. Foreign capital, much of it speculative, flowed into Melbourne, from where most of the continent’s mining operations were financed and controlled. Again, there followed a balance of payments crisis and financial collapse with the bursting of a Melbourne property bubble. “Export earnings had accounted for 28 percent of GDP in 1861-65, but only 14 percent by 1886-90”, write Barrie Dyster and David Meredith. “The cost of servicing Australia’s international debt rose from 15 percent of export earnings in 1880 to 40 percent in 1890”.[12]
Australia-wide, the mining booms stretched into the first decade of the twentieth century, when the country became the world’s largest producer of gold. Total production was larger every year from 1899 to 1908 than in the record years of the 1850s.[13] During their gold mining peaks, the commodity overtook wool as the largest export from each of Queensland, Victoria, New South Wales and Western Australia (country-wide, wool was the dominant export until the 1950s, except for 1850-70 and at the end of the 1890s). As historian Geoffrey Blainey noted:
Gold had stimulated such an expansion of Australia’s economic fabric that the economy became strong enough to cushion mining’s fall. Possibly no other country in the world had been so quickly transformed by metals… The swift growth of population widened the market for Australian manufacturers and foodstuffs. It stimulated farms and factories and workshops and cities. Gold drew population into the interior and attracted railways from the ports… Goldmines were a vast market for timber, candles, boilers and engines and pumps, and even in the 1880s Victoria’s mines used more horsepower than all its factories, and were the mainstay of the engineering industry.[14]
It wasn’t just gold mining. In the 1840s, the Burra copper mine had transformed South Australia from a depressed outpost to the wealthiest part of the continent, until the rush to Victoria took the labour away. By the 1870s South Australia was the largest copper region in the British Empire. It was spent by the 1880s, but copper, iron ore, coal, silver, lead and tin deposits were soon found elsewhere. Advances in metallurgy, chemical and mechanical engineering and the discovery of harder to extract mineral deposits transformed the industry to one that was more capital intensive and in which big mines and big companies dominated. The epitome of this trend was Broken Hill, with its huge silver, lead and zinc deposits (the Port Pirie smelters by the 1920s were the largest in the world, producing 10 percent of the world’s lead). The big operations that were now undertaken became responsible for greater diversification of the national division of labour as the realised value was transferred into other industries – in particular residential investment, which accounted for more than one-third of total capital formation in the second half of the nineteenth century, an indication of the expansion of the population.[15] Blainey again:
Some of these [mining] companies financed and directed much of the industrialisation of the nation, becoming leaders in iron and steel, shipbuilding, heavy chemicals, fertilisers, paper, paints, aircraft production, aluminium, the refining and fabrication of metals. Their technical mastery in mining was the prelude to industrial mastery.[16]
However, despite the extraordinary wealth being generated, mining’s share of capital investment never reached 1 percent in the nineteenth century.[17] And, relatively, the industry declined in size and importance over the next 50 years even as its capital intensity increased. Jacob Marsden notes:
While resource abundance gave Australia a head start in the nineteenth century, it did not ensure a continuation of growth thereafter. The only way Australia could continue to prosper from its high income base was through technological diffusion, technological progress, and imitation. [In the twentieth century,] Australia succeeded in creating a strong economy through innovations, investment in education, and import of knowledge… Domestic research intensity, measured by patents in percentage of employment, [was] important for growth… Furthermore, Australia…received substantial benefits from international knowledge spillovers through the channel of imports because of its close trade links with the most innovative economies of the world.[18]
Marsden fails to note tariff and quota protection from international competition, which was of decisive importance to industrialisation, particularly after the Great Depression. Manufacturing and services increased their share of exports as the economy further diversified and domestic consumption played a greater role as a driver of economic growth. As the Australian Bureau of Statistics notes:
With manufacturing seen as vital for national development, the pre-war protective tariff remained, and import licensing restrictions and controls were retained until 1960. As a result, by the beginning of the 1960s manufacturing’s share of GDP and employment had reached historic heights… The development of the motor vehicle industry created further demands for steel, gas, plastics and rubber. In 1960 one person in 16 of the entire Australian workforce was employed in the manufacture, distribution or servicing of this industry… [M]ore capital intensive industries such as electrical goods, chemicals and industrial metals steadily increased in size. For example, employment in the metals and engineering industry, as a proportion of total manufacturing employment, increased from 18 percent in 1871 to 48 percent in 1968, reflecting its centrality to the Australian industrialisation process… During this period the structural changes to the sector were significant, but not so great as to ensure Australia’s relative competitiveness, particularly in the 1960s. By this time the rapid growth afforded by the domestic market in the 1950s had ended and, although manufacturing exports increased, the rate of growth was small and compared poorly with that in other developed countries.[19]
In the early 1950s, the economy was most diversified: agriculture and manufacturing each contributed 20-30 percent to GDP, mining about 5 percent and services about 50 percent. Agriculture’s share of GDP dropped precipitously from the mid-1950s and manufacturing’s from the late 1960s (although the sector’s export share increased; see Appendix, Table 1), while the services sector expanded rapidly.[20] The exploitation of new resources and booms related to the rise of Japan and the oil shock of the mid-1970s paved the way for another export expansion, and an even more broadly-based resources industry – iron ore, oil, gas, coal, gold, copper, alumina and aluminium, nickel, zinc, diamonds and others. Resources exports climbed to 27 percent of total exports in 1970.[21] At the end of the twentieth century, the mining industry had rebounded from its mid-century decline to be 8.8 percent of GDP, contributed 35 percent of total exports of goods and services and accounted for 1 percent of national employment.[22]
The mining boom of the twenty-first century is the largest since the gold rush of the 1850s (although mining’s share of GDP is smaller than in the late nineteenth and early twentieth century boom in WA), comes at a more advanced stage of Australia’s capitalist development, and incorporates three overlapping phases:
In the first two phases, Chinese steel and energy firms were buying iron ore and coal at prices well above the costs of production and their true value. Mining companies were making super-profits. Gross domestic income (the purchasing power of the total economy) rose much faster than GDP (what the total economy was producing) as money from the rest of the world was sucked in. (GDI is GDP plus the trading gains delivered by the increased terms of trade; see Appendix, Chart 1.) To illustrate the scale of the income gain, economists Peter Sheehan and Bob Gregory note that, over the decade to 2013, real GDI in Australia increased by 27 percent more relative to real GDP than in the US, “an extraordinary and unprecedented change in income relativities”.[25] Consultancy firm McKinsey estimates that 90 percent of GDI growth between 2005 and 2013 derived from capital investment and the terms of trade.[26]
Fewer of the proceeds, compared with the 1850s boom, were retained in Australia. Mining companies and their owners took the lion’s share, much of which was repatriated overseas (by one estimate foreign ownership in the mining industry might be as high as 80 percent).[27] Yet other industries were boosted – those serving mining, such as transport and logistics, engineering construction and legal and business services. Mining and mining-related industries, while accounting for only 20 percent of the total economy, contributed up to two-thirds of real GDP growth in 2011-12.[28] Some of the value derived from mining was transferred through government spending and tax cuts, which were sustained by rising state mining royalties and federal company tax revenues. A smaller amount was passed on through dividends received by Australian shareholders in mining corporations and via the high wages of mining workers. Connolly and Orsmond estimate:
Australian residents accrued a little over half of the total receipts earned from current mining operations. In addition, perhaps half of the total costs of mining investment [were] spent acquiring domestically supplied labour and other inputs, which generated further activity in the Australian economy.[29]
Importantly, the rising exchange rate for the Australian dollar increased the import-purchasing power of the whole population. A simple way of understanding money is as a claim on a portion of the products of total social labour. Seen this way, exchange rate appreciation enabled one Australian dollar to claim a greater share of value produced globally by labour. Sheehan and Gregory note:
[T]he diversion of gross national expenditure to imports over the past decade has been without precedent in the recent historical record. Between 2001-02 and 2011-12, the share of net imports (imports of goods and services less exports, in volume terms) to gross national expenditure (GNE) rose from -7.8 percent to 3.9 percent, a change of 11.7 per cent of GNE. This reflected several factors, including the changing global competitive position associated with the rise of Asia, the capital investment boom and the rising Australian dollar exchange rate. But, even if all imports of capital goods are removed from net imports, the rise in the net imports to GNE ratio over the decade is still about 9 percentage points.[30]
A 2014 Reserve Bank research paper estimated that, through these various mechanisms, the mining expansion over the course of a decade increased real per capita household disposable income by 13 percent. In effect, the economy received a boost from overseas resource importers, without increasing its output commensurately.
Not everyone was a winner. In previous booms, the increase in miners’ wages spilled over to other sections of the working class. Not so this time, due to the weakness of the labour movement and because centralised wage fixing was done away with several decades ago. It is true that real wages were rising, but this obscured something else. As then Reserve Bank assistant governor (now governor) Philip Lowe noted in 2011:
For firms, what matters is the wage they pay, relative to the price of the goods and services that they sell – the so-called real product wage… Since 2000, the economy-wide real consumption wage has increased by around 25 percent, which represents a substantial increase in the purchasing power of the average wage. In contrast, over the same period, the aggregate real producer wage has increased by only around 10 percent. This relatively modest increase in the cost of hiring labour relative to the price at which aggregate output is sold has contributed to an increase in the aggregate profit share of national output, which is currently around its highest level in the past 50 years.[31]
The ruling class viewed this as a good thing for obvious reasons, and also because it wanted to avoid an inflationary spike. But while there wasn’t a generalised wave of inflation, much of the household income gains went into the residential property boom.[32] As the income gains accrued, the banks borrowed against them in global markets. They put that money into mortgages, which have grown in size, pushing up private debt dramatically. The appreciation of the exchange rate decreased the competitiveness of other trade-exposed industries – sections of manufacturing, tourism, education and agriculture – whose prices are set or significantly influenced by the world market. Exports of manufactured goods and services grew at around 10 percent per year in the 1990s; that growth slowed significantly from the early 2000s.[33] So while the late nineteenth century boom helped to propel manufacturing, the latest proved a hindrance. The steel industry and motor vehicle manufacturing, noted above as the most important early- and mid-twentieth century drivers of industrialisation and diversification, are obvious casualties – although mining only put the nails in their coffins.
When the first two phases of the boom gave way to the third, there was a reversal of fortunes, at least to a degree. As the huge investments were completed, mining productivity rose sharply as thousands were laid off, costs were reduced and output expanded dramatically. The simultaneous slowing of Chinese growth and global overcapacity in the steel industry caused iron ore, thermal and coking coal prices to collapse. With them, the terms of trade dropped as the exchange rate depreciated. This was a positive for the mining companies because commodity prices are denominated in US dollars, so the depreciating Australian dollar partially offset the declining prices. The investment phase transferred income to other industries, but in the production phase more of the export gains accrue to the overseas owners, rather than being recycled into the broader economy. This is partly offset by the degree of Australian ownership in overseas mines.
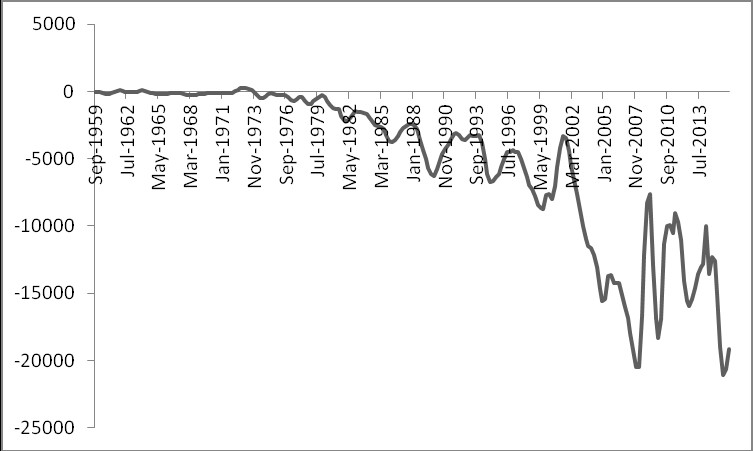
There are a number of immediate and medium term challenges for Australian capitalism as it transitions from the investment phase of the mining boom. The first, and immediate, challenge is the reversal of the relationship between domestic income and domestic product: GDI, since the March quarter of 2012, has grown much more slowly than GDP. In late 2014 and the first half of 2015 there was an income recession.[34] So the share of value being accrued in the form of national income is now growing more slowly than the value of output. This comes as the current account has deteriorated rapidly (see Appendix, Chart 3). It also comes on top of the longer term trend of increased reliance on international markets to fund domestic credit expansion. Since the 1990s, credit growth has outstripped the expansion of domestic deposits, leading banks to rely more on international wholesale funding. By 2014, the “funding gap” – the difference between the new loans issued and the deposits that finance the loans – was estimated to be more than $600 billion.[35] That trend has been reversed in recent years. But the domestic savings rate is again declining and wages growth has stalled: for the last five years, the growth in average earnings per hour has been declining. It is now at about zero. As The Australian’s economics editor David Uren points out:
Australia has suffered one of the steepest falls in wage growth of any advanced country… The 1.6 percentage point fall in Australia’s wage growth was greater than in any other area except the troubled Mediterranean and eastern European countries and The Netherlands… The Reserve Bank estimates that wage growth has fallen by twice as much as one would expect, given the level of unemployment… From the point of view of the consumer, wage growth has been around zero, relative to prices.[36]
So national income growth has stalled, wage growth has stalled, yet credit continues to expand and import expenditures are significantly outstripping export revenues. All this raises the question: can the lost income be replaced and, if not, how much longer can the economy borrow in the face of stagnant income growth?
The second challenge, connected with the first, is how Australian capitalism can compete in a more thoroughly integrated global economy. There has been a shift in relative world prices over the last two decades as China has become a manufacturing powerhouse. Australian manufacturing has lost domestic market share and exports have stagnated not simply due to the high exchange rate, but because of the rise of low-cost operations in the Chinese export zones and elsewhere. The 2014 Australian innovation system report notes:
Australia has considerably lower economic complexity than most advanced economies in spite of having the 6th highest income. Australia has 19 internationally competitive industry sectors… By contrast, comparator countries have around 35… In addition, Australia’s exports have become less complex in the past 15 years. This means that Australia’s capacity to be internationally competitive in a range of diverse and complex products has declined, despite some emerging export industries. We rank as one of the countries with the least diverse export profiles among the OECD.[37]
In part this is due to falling trade barriers and the resources boom increasing the mining industry’s share of exports. However, the long term driver is the shift in the balance of the world economy, which has squeezed many Australian firms between the large economies of scale and high productivity corporations of the West and the high output, low-cost companies in the underdeveloped world. The Office of the Chief Economist notes:
[I]n 1969, OECD countries accounted for over 90 percent of Australia’s total imports of manufactures, the four newly industrialising economies (NIEs) of Hong Kong, Singapore, South Korea and Taiwan supplied about 3 percent, while China and the rest of the world combined accounted for less than 5 percent. By contrast, in 2012, the OECD accounted for around 50 percent of Australia’s manufactures imports, while the NIE share was 8 percent. China has increased [its] share from 1 percent to 24 percent while the rest of the world increased [its] share from 4 percent to 18 percent of Australia’s imported manufactures.[38]
These challenges relate to a central question for the Australian ruling class: how to capture a greater share of income in the international division of labour? The general answer is either to push down production costs or increase productivity (increase the total amount of use-values produced, while decreasing the amount of labour expended in the production process) through the introduction of new technologies that increase output per worker, thereby making companies and national industries more competitive. For the ruling class, productivity is important not because increased output per hour allows a higher standard of living for workers, i.e. the majority of the population. It is a profit, rather than a humanitarian, calculation: the commodities produced by the most efficient businesses – those that create goods and services using less labour time than the industry average – still sell for the price that expresses the average cost of production. These firms are able to take a greater share, relative to their labour performed, of the total industry value returned in the form of sales revenue, thereby obtaining a super-profit.
National accounts deal with factors of production, from which several measures of productivity are derived. The simplest is labour productivity: the amount of GDP produced, or “value added”, per hour worked. Labour productivity growth slowed in the advanced economies over the last decades – although in the 1990s the pace increased slightly. In Australia, productivity in “market sector industries” grew by 25 percent over the decade from 1994-95; manufacturing productivity was up 24 percent. By contrast, over the last decade, market sector industries productivity increased 13 percent. Manufacturing productivity rose just 6 percent.[39] How can the ruling class turn the situation around? Government and others say innovation – greater investment in things such as software, research and development (R&D), patented technology and training. In this area, Australian capitalism is a laggard. The ratio of such investment to physical capital investment in 2010 was about half the OECD average and one-fifth of the US.[40] According to ABS figures, over the five years to 2013-14, business expenditure on R&D decreased from 1.37 percent to 1.19 percent of GDP – a 13 percent decline.[41]

The government warns that the country’s rankings “have been falling on world competitiveness indexes” – which generally are a gauge of how corporate-friendly the local rules are. Such rankings are impacted positively by greater commercialisation of research (therefore of higher education), greater involvement of corporations in universities, fewer government regulations that constrain private investment and so on. According to a 2014 joint paper from the ministries of industry and education: “Australia ranks 29th and 30th out of 30 OECD countries on the proportion of large businesses and small to medium enterprises collaborating with higher education and public research institutions on innovation… [and] 23rd out of 32 countries on the percentage of total research publications that are co-authored by industry and the research sector”.[42]
Fewer than 6 percent of Australian firms develop new-to-market innovations, compared with 17 percent in Germany and 26 percent in Sweden. The Department of Industry notes that the “4,000 largest firms, which account for 66 percent of investment in R&D, 44 percent of industry value added and around 95 percent of exports, are…ranked at 21st out of 29 OECD countries”.[43] The department also noted last year: “Australia ranks…23 out of 26 OECD countries for businesses collaborating on innovation [and] last out of 30 OECD nations for business–research collaborations”.[44] It has identified five priority areas in which this situation can be turned around: food and agribusiness; mining equipment, technology and services; oil, gas and energy resources; advanced manufacturing; and medical technologies and pharmaceuticals:
The preliminary results show that, collectively, the five sectors comprised around 14.9 percent of total businesses in Australia. Their combined share of overall industry gross value-added and employment in 2013-14 was around 16 percent and 11.6 percent respectively and in 2011-12 accounted for at least 35.7 percent of business expenditure on R&D, while their share of the value in exports was around 26.5 percent. Labour productivity and R&D intensity for most of the five key sectors are well above the all-industry average. These sectors are well positioned to take advantage of emerging opportunities and have strong prospects for future growth. This is particularly important in the current context where the resources investment boom has peaked and Australia needs new sources of growth. Long-run prosperity depends on domestic industries that remain globally competitive and productive in the light of intensified global competition.[45]
There are obvious problems. Two of the five sectors are tied to resources investment – the field from which the economy is transitioning – and a third is food, which hardly creates huge opportunities to export more highly processed, advanced “value added” products. Further, the government’s own figures tell us that in the final two sectors:
Relatively fewer firms were operating in advanced manufacturing (around 19,000 or 6.1 percent of the combined key sector firms) [or] medical technologies and pharmaceuticals (around 7,000 or 2.1 percent)… Small employing firms (with between 1 and 19 employees) account for the bulk of firms in the advanced manufacturing and medical technologies and pharmaceuticals sectors. In line with the overall business population, medium and large firms represent only a relatively small proportion of the total firm count of the five key sectors.[46]
This is important not only because the priority areas have minuscule weight in the economy, but because the “bulk” are small firms, which in the broader economy account for less than 17 percent of all R&D expenditure. By contrast, the 5 percent of businesses that are considered medium- or large-sized contribute more than 80 percent of all research undertaken (see Appendix, Table 3).[47] The focus on innovation and start-ups might well help a series of companies become niche market “world leaders” that “take advantage of Australia’s highly skilled workforce and are difficult to replicate in low-cost economies”.[48] Indeed, there is evidence of a resurgence of manufacturing in Melbourne and that pharmaceutical businesses are thriving in Sydney.[49] Over time, however, who’s to say that a greater share of the population in low wage economies such as China will not be trained and retained as investment is directed into increasingly capital intensive and sophisticated industries with niche markets?
Moreover, by the government’s own data, the Australian manufacturing industry is one of the most “innovative” in the world, ranked fourth in the OECD.[50] That hasn’t stopped the productivity slowdown. This shouldn’t be surprising. The Department of Industry notes that innovation contributes only 12-20 percent of average labour productivity growth. What fundamentally drives productivity growth is an increase in the physical capital to labour ratio (usually involving greater mechanisation/computerisation of the labour process to allow a worker to process a greater amount of raw materials or data in a given time) and the creation of greater economies of scale in the production process. That in turn spurs economic growth as the social division of labour becomes more complex through the ever greater production of “intermediate products” (partly finished goods, used as inputs in the production of other goods) and as the labour process becomes more and more specialised.
The big issue for Australian capitalism is the general decline in such investment, led by but not confined to the mining industry. Manufacturing investment dropped from a peak of $14 billion in 2005-06 to $8.6 billion in 2014-15.[51] The decline, as noted in Table 2, is uneven, but by and large across the board in recent years (excluding debt-funded residential property construction), despite the Reserve Bank lowering borrowing costs to historic lows. Why this is the case is not totally clear. The general rate of profit is far from depressed,[52] although company gross operating profits dropped in the December 2015 quarter and the March 2016 quarter in wholesale trade, mining, manufacturing, utilities, retail trade, finance, professional and scientific services, and media and communications among others.[53] But clearly there has been more to it than just profits, as Australian Financial Review senior reporter Vesna Poljak writes:
The national business investment drought shows no signs of fading… Spending by listed industrials companies will fall to a 21-year low in 2017…despite the big capital-expenditure projects under way from Transurban and Telstra, which together accounted for 18 per cent of total capex in 2014-15… The real problem is that in 2016-17 the estimate for total [capital expenditure] spending stands at $82.6 billion, which is about 20 percent less than was forecast for 2015-16… To motivate companies to invest, there needs to be confidence, profitability and tight capacity. The final two are aligned, it is just the confidence around demand and growth that is missing.[54]
Large business investments need to generate returns not just for this year or next, but for a decade or more to get back the money outlaid. Today, nothing seems assured. Perhaps the prospect of any new global shock and the realities of the Chinese slowdown, financial market and political volatility may be pushing the risk-return calculations of companies in a negative direction. Perhaps many in the ruling class, faced with low global growth and negative interest rates, are waiting to see whether or not this is cyclical, something that will finally turn around, or structural, a “new normal” of low inflation and sluggish growth. Whatever it is, the investment just isn’t coming at this point.
When you mate a donkey with a zebra you get a dear little useless thing with stripes and big ears called a zedonk. Sometime in the 1980s…a chap in the Otway Ranges value-added his donkey into a zedonk and leveraged it into a “tourist attraction”. To help him along with his start-up he got hold of several thousand dollars from the Victorian Economic Development Corporation, which had been created by the Cain Labor government to provide venture capital to entrepreneurs with this sort of vision and get up and go… I’d forgotten the zedonk until Malcolm Turnbull’s innovation statement last week brought him clip-clopping back… We are entreated to “embrace change”, “embrace risk” and “embrace innovation”; “identify opportunities”; to be “adaptable, flexible and innovative”.
– Don Watson, former speechwriter for Paul Keating[55]
When a national industry’s productivity is lower (or its costs higher) than the global average, a government might impose import tariffs or quotas, artificially pushing up international competitors’ sales prices, enabling national firms to compete in the domestic market as though they were more efficient than they are. It might provide specific tax breaks or direct industry assistance to the same end – shifting a portion of national income from unprotected to protected industries. Alternatively, a government might let an industry die a “natural death”, calculating that it is too costly, and perhaps ultimately impossible, to battle the levelling forces of the global division of labour. The Australian car industry is one example among many that benefited from state protection before being flattened by the vastly greater economies of scale of its international competitors.
More broadly, states create a favourable environment for their business class as a whole by providing infrastructure, an educated and relatively healthy workforce, sanitation, law and order. State institutions (the Productivity Commission in Australia, for example) also monitor national productivity movements and contrast them with those of the rest of the world before making policy recommendations to governments. Importantly, richer states might take on the burden of financing industry R&D through their capacity to mobilise resources and take losses on a scale that only the biggest individual companies can. Such has historically been the case with the CSIRO, the stated goal of which is “to initiate and conduct scientific research to assist in the development of [Australian] industries”. It’s also a role taken on by universities, usually with significant government funding.
Some countries develop coherent national plans to advance their economies. The Soviet Union, Japan and South Korea are obvious twentieth century examples. Australian governments also, at times, pursued development plans: import substitution; mass migration and “nation building” projects; and the neoliberal transition that unleashed private finance, reshaped industrial relations, brought down tariffs and marketised many more areas of society. The scope for coherent planning has declined. In part that’s because of the broader global malaise. It’s also because the world social division of labour has become increasingly complex and differentiated. Technological diffusion and the expansion of global “value chains” mean that ever more sections of the economy are becoming trade exposed. As McKinsey notes:
Across sectors, global supply chains are fragmenting, and countries are further specialising what they produce. Apple’s iPod is a good example. It contains 451 distinct components sourced from around the world; the ten most valuable components alone are sourced from six different countries; and many require significant research and development. As a result, global flows of intermediate goods are 3.2 times greater than flows of final goods, and are growing at a faster rate. The fragmentation of supply chains means competition is moving from the level of industry sectors (like manufacturing or retail) to segments of the value chain (like design or logistics).[56]
The lack of economies of scale and the limited resources available to the state are additional obstacles to effective planning in countries with small populations, like Australia. Perhaps, given the global changes, the only practical thing to do is encourage industries with some serious prospect of long or even medium term success – mining, agriculture, tourism, education[57] – and make a few bets on and encourage high tech prospects. That seemed to be the orientation of the 2015 “national innovation and science agenda”, which was supposed to provide a roadmap to economic growth through the construction of an agile “twenty-first century economy” to take advantage of the changing world economy. However, it was worth only $1.1 billion over four years – some tax changes, bankruptcy law changes, probably several tens of millions of dollars in branding, advertising and consultancy fees to make sure that everyone knows that there is now an “ideas boom” taking over from the mining boom, and perhaps a couple of zedonks thrown in for good measure. The Liberals made a big deal about a $20,000 accelerated depreciation write-off for small businesses and a few percent company tax cut in the 2015 and 2016 budgets. But considering that in the decade to 2014, more than $400 billion of resource projects were initiated, how many plucky mum and dad start-up companies would it take to fill the investment gap that has now opened up?
Governments could be doing more to tackle the well-reported public infrastructure deficit, particularly in urban transport, to increase national productivity indirectly by reducing bottlenecks, increasing technological diffusion and generally ensuring the smooth functioning of businesses. The 2015 national infrastructure audit found:
[T]he overall quality of [Australia’s] infrastructure lags behind comparable nations. For example, the World Economic Forum has ranked the quality of Australia’s infrastructure 20th out of 144 countries. Some of the poorest scores were for the quality of Australia’s roads and ports. The World Bank’s Logistics Performance Index 2014 ranked Australia’s trade and transport infrastructure 16th in the world… The cost of congestion in our capital cities, estimated at $13.7 billion in 2011, is expected to increase to around $53.3 billion in 2031, or around 290 per cent, in the absence of additional capacity and/or demand management.[58]
Yet, a year later, public building construction expenditure as a proportion of GDP is at its lowest level in more than 25 years; engineering construction is at the lowest point in a decade.[59] There is a lot of talk about asset recycling and a few big ticket projects at the state level – but it’s all pretty small beer in the scheme of things.
The problem is not purely economic, but illustrates the political project pursued by successive governments, which arguably has been detrimental to the broader needs of capital accumulation. Between 2006 and 2012 the minerals industry paid almost $117 billion in company tax and royalties.[60] It should have paid much more with the introduction of a super-profits tax – in 2014-15 alone, export earnings from resource and energy commodities reached $174 billion. Either way, during the income boom, the federal Coalition government initiated tax policies that siphoned the gains to the top 10 percent of income earners and residential property investors, rather than transfer the proceeds to industrial development in other areas of the economy. International Monetary Fund researchers estimate that the later years of the federal Coalition government led by John Howard were the most “profligate” in 50 years.[61] As the Australia Institute’s Richard Denniss notes:
During the first phase of the mining boom the federal government’s coffers were being filled with a temporary windfall gain. [Treasurer] Costello made the decision to use this temporary windfall gain to cut income tax, mainly to high income earners. From 2005 to 2012 these tax cuts cost the budget bottom line $170 billion. In 2012 they were costing the budget $37.6 billion per year. Even accounting for bracket creep, the tax cuts would cost the budget $26.4 billion in 2011-12. They would be worth more today. Forty-two percent of these cuts flowed to the top 10 percent of income earners.[62]
Added to this was the decision to grant superannuation tax cuts for the rich, and allow excess franking credits accruing to share market investors to be refunded in cash. Even John Hewson, former federal Liberal leader and economics professor, can admit that the budget deficit – and the associated national debt, which today costs an estimated $12 billion per year in interest payments – has been constructed unnecessarily. He told The Saturday Paper in 2014, “They’ve basically imposed it on themselves”.[63]
Now, however, with the end of the boom there are clearly economic constraints. Tax revenues continue to rise, but never to the level of Treasury’s previous expectations. Labor treasurer Wayne Swan’s final budget in 2013 noted: “Tax receipts…have been revised down by around $60 billion over the four years to 2015-16”. That came on top of $170 billion of downward revisions over previous years due primarily to the global financial crisis. Under the Liberal government between the 2013 election and May 2016, Treasury wrote down tens of billions of dollars more. Each budget and each mid-year economic and fiscal outlook have downgraded revenue growth forecasts.
It should be noted that the tax changes of the Howard Liberal government, kept by subsequent governments, have little to do with promoting capital investment. Exactly why this course was pursued is not entirely clear. Obviously there was an element of vote buying with the tax cuts, and a dose of “trickle down” and “efficient market hypothesis”[64] ideological blindness, but these alone are inadequate as explanations: if large sections of the ruling class were genuinely concerned about the decisions being made, more pressure would have been brought to bear on the politicians to act. The explanation probably lies in a mixture of short-sightedness and economic pragmatism: the good times continued to roll in Australia while the rest of the developed world sank into the worst crisis since the Great Depression. Why rock the boat by initiating some major intervention into the economy, as opposed to just lining the pockets of the wealthy and allowing the economy to “naturally adjust” as the income extravaganza continued? China’s high demand and rapid urban development would last decades, we were told. And, ultimately, investment to facilitate further accumulation was still proceeding – major road, rail and port upgrades to deal with increased trade, private optic fibre networks for large companies in the CBDs, for example.
The ruling class and the major parties have been more interested in continuing the neoliberal reconfiguration of the logic of industry assistance: more fully privatising universities, cutting direct government R&D funding, pushing for the market to arbitrate research priorities, making regulatory changes that support the construction of a more entrepreneurial spirit-world and turning to the private sector to take on infrastructure development. Targeted spending in this area will continue, but business can probably live with degraded public infrastructure as long as it doesn’t significantly impact accumulation or create the sort of social breakdown that provokes civil rebellion. If the US is anything to go by, the ruling class can write off entire sections of the country, and the population, without undermining profit-making.
The areas that will get the most attention in coming years are reducing labour costs and state spending on the working class. Both have been targeted for several decades and have again been foreshadowed by the major industry associations as the key areas for government action: attacks on penalty rates, awards and collective bargaining to reduce company operating costs and thereby increase competitiveness; cuts to health, education and welfare expenditure, and a rise in indirect taxes to enable corporate tax cuts.
The mining industry played a key role in the development of the Australian economy and its early industrialisation. The latest boom came at a moment of much greater economic diversification. While it generated a huge increase in national income, it also created a lop-sided economy and was a burden to other trade exposed industries, hastening the decline of some and killing off others. Many of the proceeds were frittered away as handouts to the rich while at the same time contributing to a speculative residential property bubble, built on extreme levels of household debt as wage gains in the mining industry failed to flow to the rest of the working class.
With the investment phase of the boom now coming to an end, capital-side problems of investment and innovation have been exposed. Australian capitalism seems healthy relative to the rest of the world. However, exactly where the economic transition is going is far from clear. The economy and the ruling class can muddle along for the time being. At some point, crunch time might come – whether due to the gap between debt and income, the failure of private sector investment to rebound or an external shock. If a crunch is somehow avoided, the forces of the global division of labour will continue to weigh on Australian capitalism. Either way, workers are in an invidious position; it is clear that they are expected to suffer falling living standards and economic insecurity in the “national interest”.
Table 1. Share of economy by industry/sector (percentage)[65]

Table 2. Private new capital expenditure by industry
(percentage change, trend)[66]
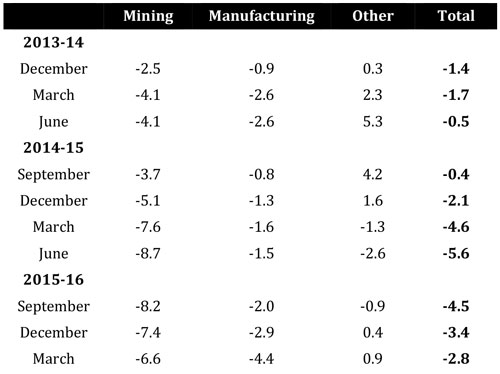
Table 3. Business size, distribution and contribution to R&D[67]
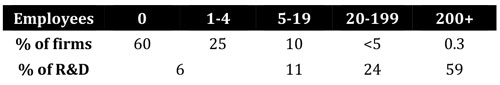
Chart 1. Gross domestic product and income
(quarterly, trend, percentage change)[68]
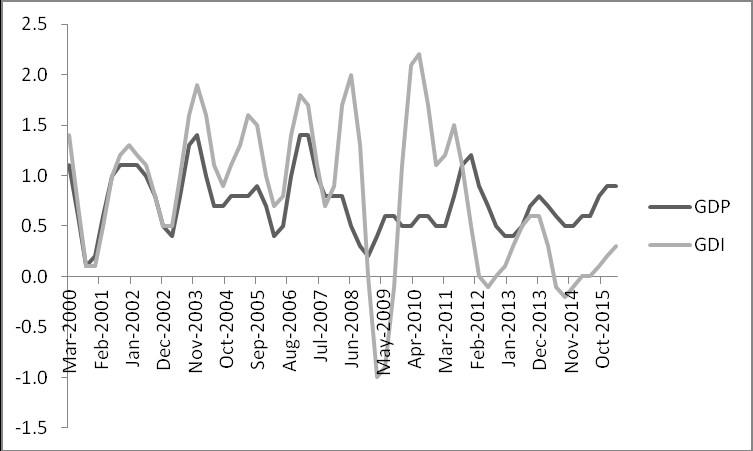
Chart 2. Labour productivity index (2013-14 = 100)[69]
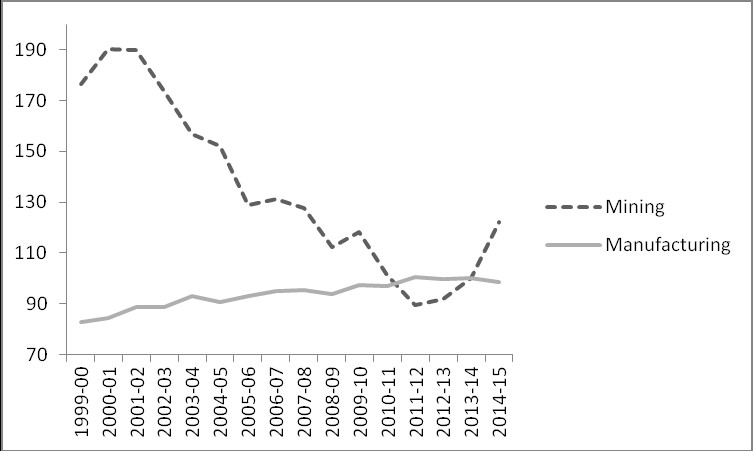
Chart 3. Balance of payments (quarterly, trend, $ millions)[70]
Australian Bureau of Statistics (ABS) 2000, “Special article – the Australian mining industry: from settlement to 2000”, cat. no. 8414.0.
ABS 2001, “Year Book Australia”, cat. no. 1301.0.
ABS 2015a, “Estimates of Industry Multifactor Productivity, Australia”, cat. no. 5260.0.55.002.
ABS 2015b, “Research and Experimental Development, Businesses, Australia, 2013-14”, cat. no. 8104.0.
ABS 2016a, “Balance of Payments and International Investment Position, Australia”, cat. no. 5302.0.
ABS 2016b, “Business Indicators, Australia”, cat. no. 5676.0.
ABS 2016c, “Australian National Accounts: National Income, Expenditure and Product”, cat. no. 5206.0.
ABS 2016d, “Private New Capital Expenditure and Expected Expenditure, Australia”, cat. no. 5625.0.
Battellino, Ric 2010, “Mining booms and the Australian economy”, Bulletin, Reserve Bank of Australia, March.
Blainey, Geoffrey 1993, The rush that never ended, Melbourne University Press.
Butlin, N.G. 1964, Investment in Australian economic development, Cambridge University Press.
Commonwealth of Australia 2014a, “Boosting the commercial returns from research”, discussion paper, Department of Education and Department of Industry.
Commonwealth of Australia 2014b, Australian industry report, Office of the Chief Economist.
Commonwealth of Australia 2014c, Australian innovation system report, Office of the Chief Economist.
Commonwealth of Australia 2015, Australian infrastructure audit, Infrastructure Australia.
Connolly, Ellis and Christine Lewis 2010, “Structural change in the Australian economy”, Bulletin, Reserve Bank of Australia, September.
Connolly, Ellis and David Orsmond 2011, “The mining industry: from bust to boom”, Research Discussion Paper, Reserve Bank of Australia.
Department of Industry 2014, “Industry growth centres initiative national roadshow”, consultation session presentation, 2014, slide two, www.business.gov.au/advice-and-support/ IndustryGrowthCentres/Documents/IGC-ConsultationSession-Presentation.pptx.
Downes, Peter, Kevin Hanslow and Peter Tulip 2014, “The effect of the mining boom on the Australian economy”, Research Discussion Paper, Reserve Bank of Australia.
Dyster, Barrie and David Meredith 2012, Australia in the global economy, Cambridge University Press.
Gruen, David 2011, “The macroeconomic and structural implications of a once-in-a-lifetime boom in the terms of trade”, address to Australian Business Economists, Sydney, 24 November.
Jones, Peter 2013, “The global economic crisis: is there any end in sight?”, talk given at the Marxism conference, Melbourne, March, www.redbookreports.tumblr.com/post/47133126869/guest-post-the-global-economic-crisis-is-there.
Kalix, Z., L.M. Fraser and R.I. Rawson 1966, Australian mineral industry: production and trade, 1842-1964, Department of National Development.
Lowe, Philip 2011, “Changing relative prices and the structure of the Australian economy”, speech to Australian Industry Group, 9 March.
Lydon, John, David Dyer and Chris Bradley 2014, Compete to prosper: improving Australia’s global competitiveness, McKinsey Australia.
Maddock, Rodney and Ian McLean 1984, “Supply-side shocks: the case of Australian gold”, The journal of economic history, 44 (4).
Mauro, Paolo, Rafael Romeu, Ariel Binder and Asad Zaman 2013, “A modern history of fiscal prudence and profligacy”, Working Paper, International Monetary Fund.
McLean, Ian 2013, Why Australia prospered, Princeton University Press.
Reserve Bank of Australia (RBA) 2016a, “Gross domestic product and income”, Statistical table H1.
RBA 2016b, “The Australian economy and financial markets”, Chart Pack, May.
Serle, Geoffrey 1971, The rush to be rich, Melbourne University Press.
Serle, Geoffrey 1977, The Golden Age, Melbourne University Press.
Sheehan, Peter and Robert Gregory 2013, “The resources boom and economic policy in the long run”, The Australian economic review, 46 (2).
Swanepoel, Jan and Anthony Harrison 2015, “The business size distribution in Australia”, Research Paper, Office of the Chief Economist, Commonwealth of Australia.
Ville, Simon and Glenn Withers 2015, The Cambridge Economic History of Australia, Cambridge University Press.
[1] Thanks to Mick Armstrong for comments on the draft, and to Rick Kuhn for a number of astute observations that helped to clarify the argument presented in the final sections.
[2] McLean 2013, pp100-1.
[3] The biggest “busts”, measured by decline in GDP per capita, occurred in the early 1840s, the late 1850s, the 1890s and the 1930s. See Jakob Madsen, “Australian economic growth and its drivers since European settlement”, in Ville and Withers 2015, p31.
[4] Serle 1977, p42.
[5] Battellino 2010, p63.
[6] Maddock and McLean 1984, p1052.
[7] Serle 1977, p382.
[8] As an example of the wash generated by mining, by the 1880s, relative to the population, Victoria had four times as many bank branches as England. See Serle 1971, p66.
[9] Butlin 1964, pp203-4.
[10] Serle 1977, p234.
[11] Serle 1977, p240.
[12] Dyster and Meredith 2012, p63.
[13] Kalix, Fraser and Rawson 1966, pp176-7.
[14] Blainey 1993, p61.
[15] Butlin 1964, p211.
[16] Blainey 1993, p253.
[17] Battellino 2010, p63.
[18] Madsen, Jakob, “Australian economic growth and its drivers since European settlement”, in Ville and Withers 2015, p51.
[19] ABS 2001.
[20] Jakob Madsen, “Australian economic growth and its drivers since European settlement”, in Ville and Withers 2015, p40.
[21] Anne Garnett, “Australia’s five-pillar economy: mining”, The Conversation, 1 May 2015.
[22] ABS 2000.
[23] Connolly and Orsmond 2011, pp4, 42.
[24] Connolly and Orsmond 2011, p7.
[25] Sheehan and Gregory 2013, p122.
[26] Lydon, Dyer and Bradley 2014, p1.
[27] Connolly and Orsmond 2011, p38.
[28] Gruen 2011.
[29] Connolly and Orsmond 2011, table 6, p31.
[30] Sheehan and Gregory 2013, pp122-3.
[31] Lowe 2011.
[32] Downes, Hanslow and Tulip 2014, pp15, 19.
[33] Lowe 2011.
[34] RBA 2016a.
[35] Jonathan Shapiro and Shaun Drummond, “Banks ramp up reliance on offshore capital markets”, Australian Financial Review, 16 June 2014.
[36] David Uren, “Low wage growth mystery perplexes pundits and RBA”, The Australian, 16 May 2016.
[37] Commonwealth of Australia 2014c, p6.
[38] Commonwealth of Australia 2014b, p111.
[39] ABS 2015a.
[40] Commonwealth of Australia 2014c, p4.
[41] ABS 2015b.
[42] Commonwealth of Australia 2014a, pp3-4.
[43] Commonwealth of Australia 2014c, pp58-9.
[44] Department of Industry 2014.
[45] Commonwealth of Australia 2014b, p116.
[46] Commonwealth of Australia 2014b, p130.
[47] ABS 2015b.
[48] Commonwealth of Australia 2014b, p116.
[49] Michael Bleby, “Melbourne industrial thrives”, Australian Financial Review, 14 April 2016.
[50] Commonwealth of Australia 2014c, figure A.8, p194.
[51] Measured in 2015 dollars. See ABS 2016d.
[52] Jones 2013.
[53] ABS 2016b, table 12.
[54] Vesna Poljak, “Growth-hungry investors at tipping point, strategist says”, Australian Financial Review, 14 April 2016.
[55] Don Watson, “Oh, for some oratory not mired in mantras”, The Australian, 19 December 2015.
[56] Lydon, Dyer and Bradley 2014, p1.
[57] Capital Economics analysts estimate: “It would require a truly phenomenal set of circumstances for tourism and education exports to provide a major boost to the economy over the next decade…the most likely scenario is that they will provide a reasonably small boost to the level of gross domestic product of around 0.1 percent a year”. Quoted in Philip Baker, “Tourism, education won’t save Australia”, Australian Financial Review, 14 April 2016.
[58] Commonwealth of Australia 2015, p9.
[59] RBA 2016b, p14.
[60] Minerals Council of Australia, “Mining industry pays almost $117 billion in taxes and royalties”, 3 October 2013.
[61] Mauro, Romeu, Binder and Zaman 2013, figure 5, p44.
[62] Richard Denniss, “Peter Costello’s five most ‘profligate’ decisions as treasurer cost the budget $56bn a year”, The Australia Institute, 15 April 2015.
[63] Mike Seccombe, “How Howard’s tax cuts undid his protégé Tony Abbott”, The Saturday Paper, 20 December 2014.
[64] The theory that asset prices fully reflect all available information, that the market is therefore efficient and that such things as “bubbles” cannot exist.
[65] Connolly and Lewis 2010, p2.
[66] ABS 2016d, table 4, p15.
[67] ABS 2015b; Swanepoel and Harrison 2015.
[68] ABS 2016c, table 1.
[69] ABS 2015a, table 6.
[70] ABS 2016a, table 4.